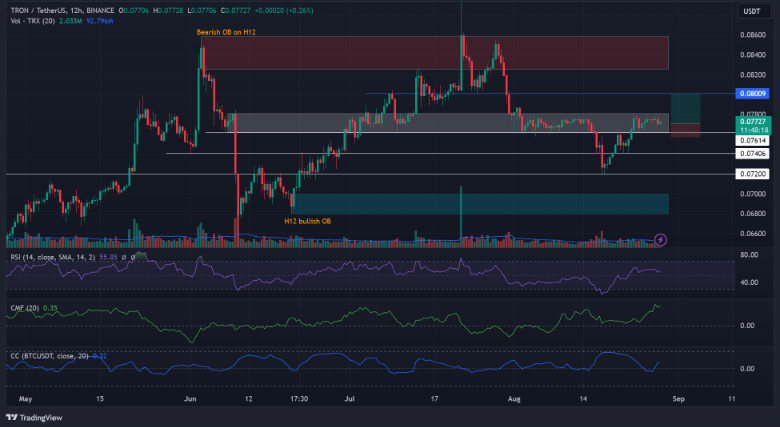
Tron (TRX) showed an incredible performance last week (August 21-27) and outperformed Bitcoin (BTC). According to the charts, while the leading cryptocurrency lost 0.34% of its value, TRX gained 2.64% in its weekly performance. The divergence from BTC’s price movement set TRX to reclaim an important previous support zone between $0.076 and $0.078. This movement can offer a long opportunity, but there was also a warning.
TRX Coin Current Situation
Since August 22, the Relative Strength Index (RSI) has been above the 50 level, indicating an increase in buying pressure in the past few days. Similarly, the Chaikin Money Flow (CMF) has not dropped below zero since the beginning of August, indicating strong capital inflow into TRX.
The next critical resistance level was $0.080, and if the bulls stay on track, it could be the next target. If so, further upside could offer a long opportunity targeting $0.080 with an entry from the support zone ($0.076 – $0.078).

However, the long opportunity was risky. Although TRX diverged from BTC last week, there were signs of a reunion as indicated by the positive correlation coefficient with BTC. Therefore, a weak BTC could break TRX’s support zone and invalidate the long setup. A candlestick session closing below the support zone ($0.076 – $0.078) would invalidate the long idea.
TRX Coin Future
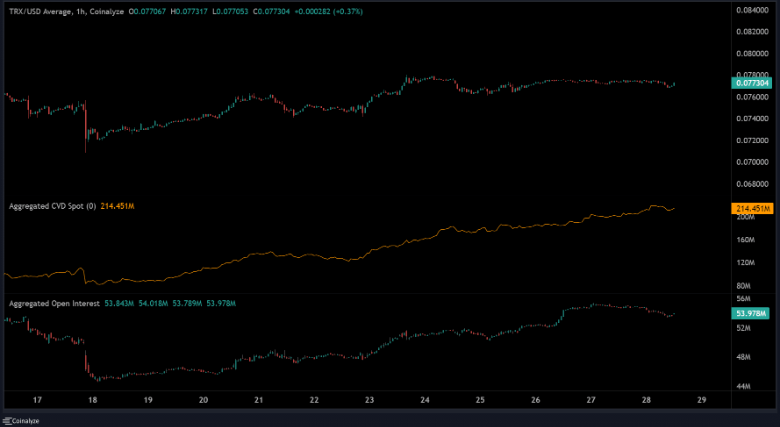
According to Coinalyze, the Cumulative Volume Delta (CVD) has had a positive slope since August 18. This indicates that buyers have steadily taken control of the market since mid-August.
During the same period, Open Interest (OI) rates also improved. They increased from approximately $44 million (August 18) to over $53 million at the time of writing this article. This increase indicates an increased demand for TRX in the derivatives segment, which could mean a bullish trend. Investors should monitor BTC price movement and TRX correlation to optimize their trading setups and minimize losses.


