COINTURK NEWSCOINTURK NEWSCOINTURK NEWS
  • Real-Time News Feed
  • Bitcoin
  • Altcoin
  • Ethereum
  • Technology News
  • Advertise
  • Contact
  • TURTURTUR
  • ESESES
Search
© 2024 COINTURK NEWS. All Rights Reserved.
Reading: Polkadot (DOT) Price Analysis: Critical Zone and Future Trends
Share
Languages
  • TürkçeTürkçe
  • EspañolEspañol
Font ResizerAa
COINTURK NEWSCOINTURK NEWS
Font ResizerAa
Search
  • Real-Time News Feed
  • Bitcoin
  • Altcoin
  • Ethereum
  • Technology News
  • Advertise
  • Contact
  • TURTURTUR
  • ESESES
Follow US
© 2025 BLOCKCHAIN Information Technologies. >> COINTURK NEWS
Powered by LK SOFTWARE
COINTURK NEWS > Polkadot (DOT) > Polkadot (DOT) Price Analysis: Critical Zone and Future Trends
Polkadot (DOT)

Polkadot (DOT) Price Analysis: Critical Zone and Future Trends

In Brief

  • Polkadot (DOT) price has been trading above the long-term horizontal support area for 1,100 days, currently at $4.30. Whether the price will bounce in this region and start an upward movement or break it will help determine the direction of the future trend.ContentsCritical Zone for DOT Price!Trends for DOT Data Critical Zone for DOT Price! […]
COINTURK NEWS
COINTURK NEWS 2 years ago
Share
SHARE

Polkadot (DOT) price has been trading above the long-term horizontal support area for 1,100 days, currently at $4.30. Whether the price will bounce in this region and start an upward movement or break it will help determine the direction of the future trend.

Contents
Critical Zone for DOT Price!Trends for DOT Data

Critical Zone for DOT Price!

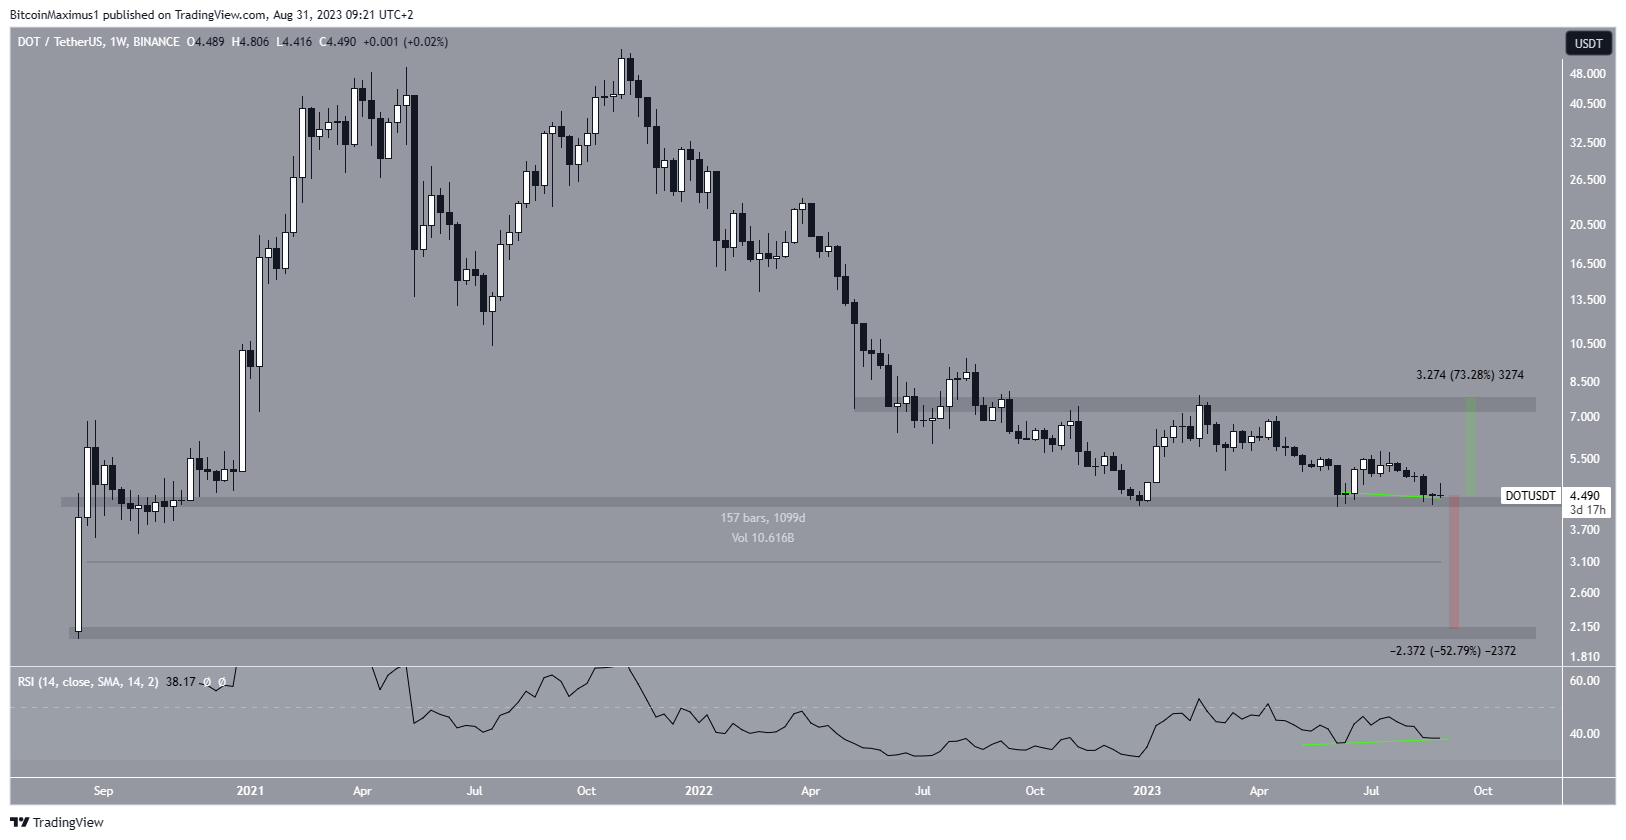
The technical analysis for the weekly timeframe shows that the DOT price is trading above the $4.30 horizontal support area. This level is critical as it has been present for 1,100 days. Due to the length of time that the area has provided support, it is crucial for the price to stay above this level to sustain the upward trend.

If the DOT price bounces, the next resistance level could be $7.70, which is currently 74% above the current price. On the other hand, a potential breakdown could lead to a 53% drop to the next closest support at $2, which corresponds to the all-time low levels. The weekly RSI presents an uncertain reading. Investors use RSI as a momentum indicator to identify overbought or oversold scenarios and assist in making decisions to accumulate or sell an asset.

Trends for DOT Data

Readings above 50 indicate a bullish dominance, while readings below 50 indicate the opposite. Despite the indicator being below 50, it exhibited a bullish trend. This scenario may involve increasing momentum and a price decline that typically leads to an upward movement. Considering these conflicting signals, the RSI on the weekly timeframe may not confirm the current Polkadot trend.

According to experts, unlike the weekly timeframe, the daily timeframe presents a bearish outlook. The main reason for this is that the price has been trading within a descending triangle since the beginning of the year. A descending triangle is considered a formation that indicates a downward trend, which often leads to breakouts. Despite the bearish price prediction for DOT, a breakout from the resistance line of the triangle could mean that the trend is still bullish, and an increase to the $7.70 resistance level could be possible.

You can follow our news on Telegram, Facebook, Twitter & Coinmarketcap
Disclaimer: The information contained in this article does not constitute investment advice. Investors should be aware that cryptocurrencies carry high volatility and therefore risk, and should conduct their own research.

You Might Also Like

SEC Extends Review Time for Grayscale Polkadot ETF Application

Grayscale Seeks Approval for Polkadot Trust, Could Boost DOT’s Market Appeal

DOT Price Surges Following 21Shares’ ETF Filing

Trump’s Comments Shake Crypto Markets as 21Shares Files for DOT Coin ETF

Polkadot Shows Significant Growth Above $8, Signaling Price Momentum

COINTURK NEWS 31 August, 2023 - 1:44 pm 31 August, 2023 - 1:44 pm
Share This Article
Facebook Twitter
Share
Previous Article Bitcoin (BTC) Starts the Day with a Decline
Next Article Crypto Market Starts the Day with a Decline: Ethereum (ETH) Approaches $1700 Levels Again
Leave a comment

Leave a Reply Cancel reply

Your email address will not be published. Required fields are marked *

This site uses Akismet to reduce spam. Learn how your comment data is processed.

Stay Connected

8.1k Like
21.1k Follow
1.1k Follow

Latest News

FTX Distributes Billions, Reanimating the Cryptocurrency Market
Cryptocurrency News
MOVE Coin Faces Rapid Decline Despite Prominent Backing
Altcoin News
Fed Faces New Challenges as Economic Signals Conflict
Cryptocurrency News
Traditional Banks Drive Stablecoin Surge in Crypto Markets
Cryptocurrency News
//

COINTURK was launched in March 2014 by a group of technology enthusiasts who believe that Bitcoin will be as important as the internet in the world of the future thanks to the amazing technology underlying it.

CRYPTOCURRENCY LIVE PRICES

  • Bitcoin (BTC) Live Price
  • Ethereum (ETH) Live Price
  • Ripple (XRP) Live Price
  • Solana (SOL) Live Price
  • Dogecoin (DOGE) Live Price
  • Cardano (ADA) Live Price
  • Chainlink (LINK) Live Price

OUR PARTNERS

  • COINMARKETCAP
  • COINGECKO
  • BITCOINHABER
  • BH NEWS
  • 21MILYON
  • NEWSLINKER

OUR COMPANY

  • About Us
  • Cookie Policy
  • Advertising
  • Contact
COINTURK NEWSCOINTURK NEWS
Follow US
© 2025 BLOCKCHAIN Information Technologies. >> COINTURK NEWS
Powered by LK SOFTWARE
Welcome Back!

Sign in to your account

Lost your password?