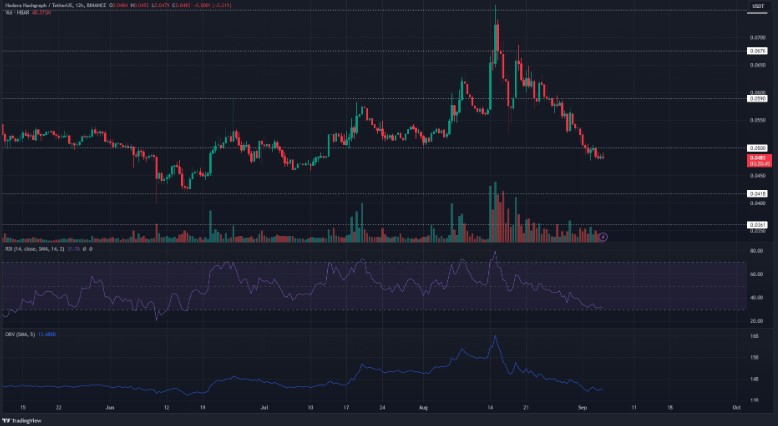
Hedera’s (HBAR) week-long price decline broke the previous all-time high and pushed prices below the critical $0.05 support level. This provided over 15% profit for those shorting HBAR. The break of the critical support level signaled a shift in momentum on higher timeframes, increasing the likelihood of further downward movement. Additionally, Bitcoin‘s (BTC) price action below $26,000 can be an excellent opportunity for bears to increase their gains.
HBAR Coin Analysis
July was a fantastic month for HBAR bulls. Buyers using the $0.05 price level as support provided a 50% price increase for HBAR. However, the price rejection at the $0.075 price zone initiated a continuous selling pressure wave. The sharp retracement between August 15 and August 17 was relieved by a bullish recovery on August 19. Nevertheless, the selling pressure continued with another price rejection around the $0.067 price zone.

This time, sellers intensified the selling pressure and brought HBAR below the strong defense of the $0.05 support for bulls. This led to a break of the previous low level at the beginning of August and signaled a downward trend in HBAR’s market structure.
Looking at the indicators on the chart, it can be interpreted that it indicates further losses. As of the time of writing, the Relative Strength Index (RSI) aggressively dropped from overbought territory and hovered just above the oversold zone. On-Balance Volume (OBV) also extended its sharp decline. Both indicators indicated a lack of bullish sentiment and demand for HBAR.
HBAR Coin Chart and Investors
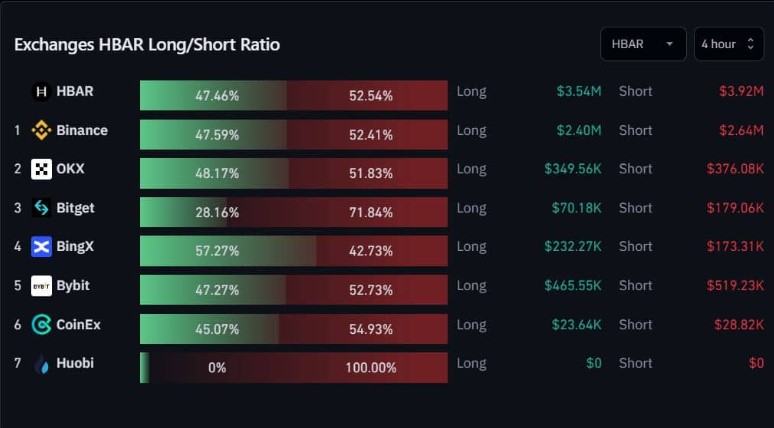
The futures market clearly showed a downward trend. Coinglass’ long/short exchange data showed that short positions had a 52.54% advantage. This means a selling position of $3.92 million compared to a buying position of $3.54 million.
Along with the negative funding rates for HBAR, shorts could reach $0.04 to $0.045, the lowest level of June, in the coming days. Additionally, investors may benefit from keeping an eye on any news regarding Bitcoin.


 Türkçe
 Español


