Binance Coin (BNB) continues to struggle with falling network metrics while expanding its sideways price movement. A recent price report highlighted BNB’s tendency to enter a range-bound movement if rejected at $225.
Binance Coin Reflects Bitcoin’s Movements!
Last week saw this scenario play out perfectly as bears managed to keep the prices below the $225 resistance level. While the leading cryptocurrency struggled to surpass the $26,000 price level, Binance Coin‘s price movement continued to mirror Bitcoin‘s price.
The On-Balance Volume (OBV) indicator highlighted the volatile nature of BNB’s trading volume in recent months. OBV experienced significant drops in trading volume at the beginning of June and the end of August. This kept BNB’s price movement in a sideways trend amidst an overall bearish market structure. Similarly, the Relative Strength Index (RSI) echoed the lack of demand for BNB. Despite a brief surge above the neutral 50 level on August 30, RSI quickly dropped below the neutral 50 and has remained there at the time of writing.

Current Data on BNB!
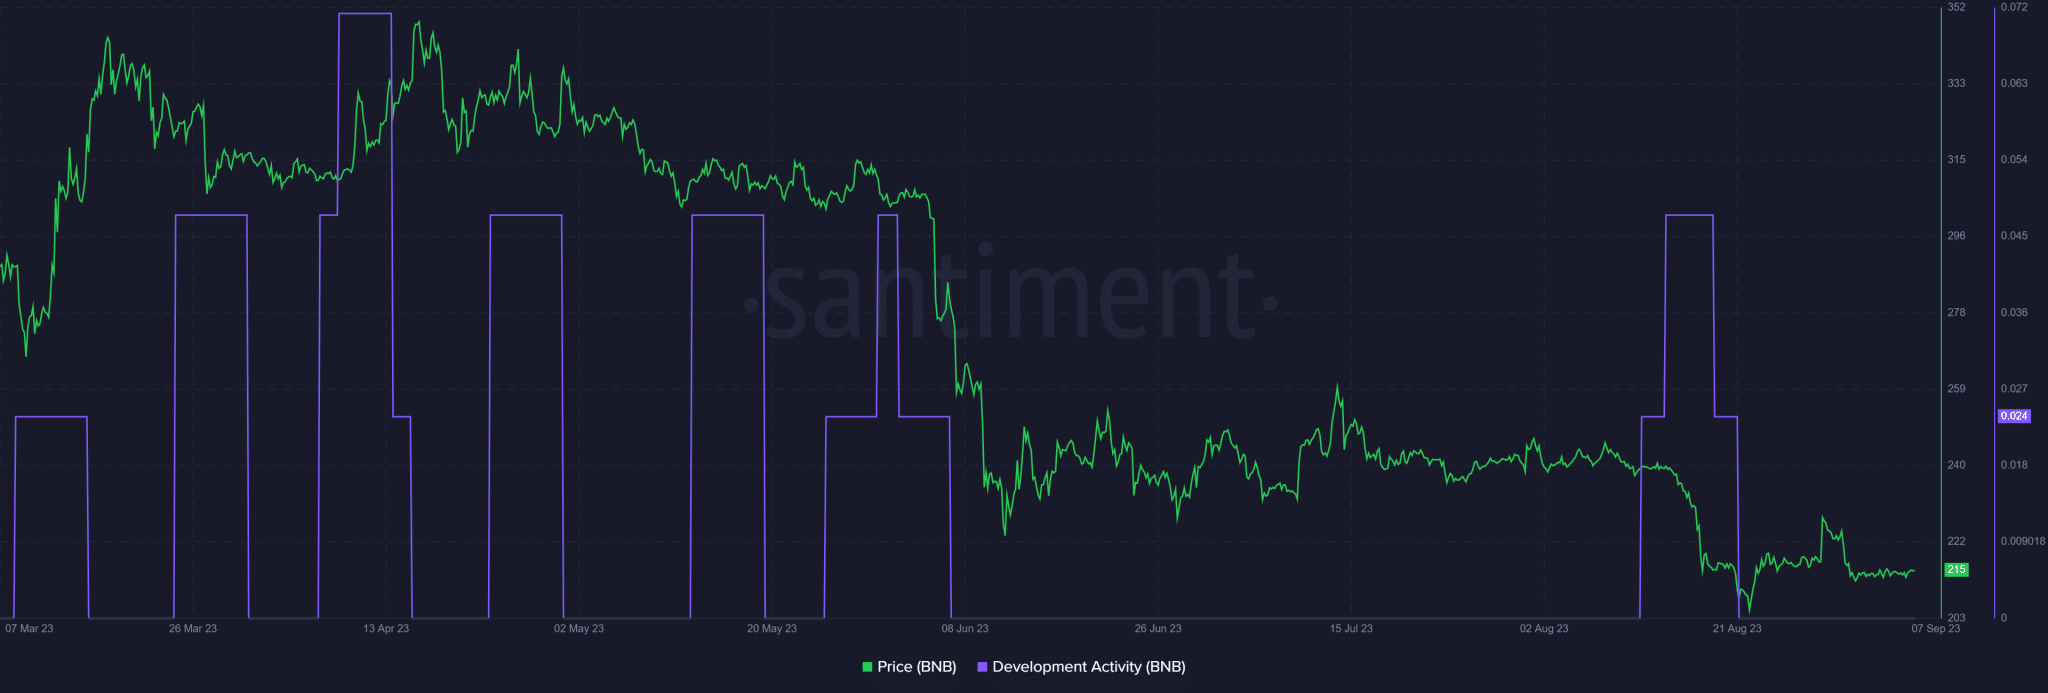
Bulls looking for an upward movement need to rely on Bitcoin surpassing the $26,000 mark, as this can add the necessary upward momentum to the market. Otherwise, bears may be content with this sideways price movement while waiting for BNB to drop to the $200 price level. As a token, BNB is intricately linked to the BNB Chain for on-chain activities. Looking at the development activity on Santiment, there has been a sharp decline since August 21.
When examining the development activity, it is noted that the price of BNB reached its peak at the beginning of the year when development activity was high. This could be due to a strong demand for BNB to power off-chain activities. The decline in development has negatively affected BNB due to decreased demand. It may take some time for BNB to achieve a sustained price reversal along with declining trading volume.

 Türkçe
 Español


