UNIBOT price broke out of a long-term formation on September 2nd and reached a low of $55 eight days later. However, the price has since made an impressive recovery by breaking a descending resistance trendline. So, what’s next for the token?
Critical Formation in UNIBOT Price!
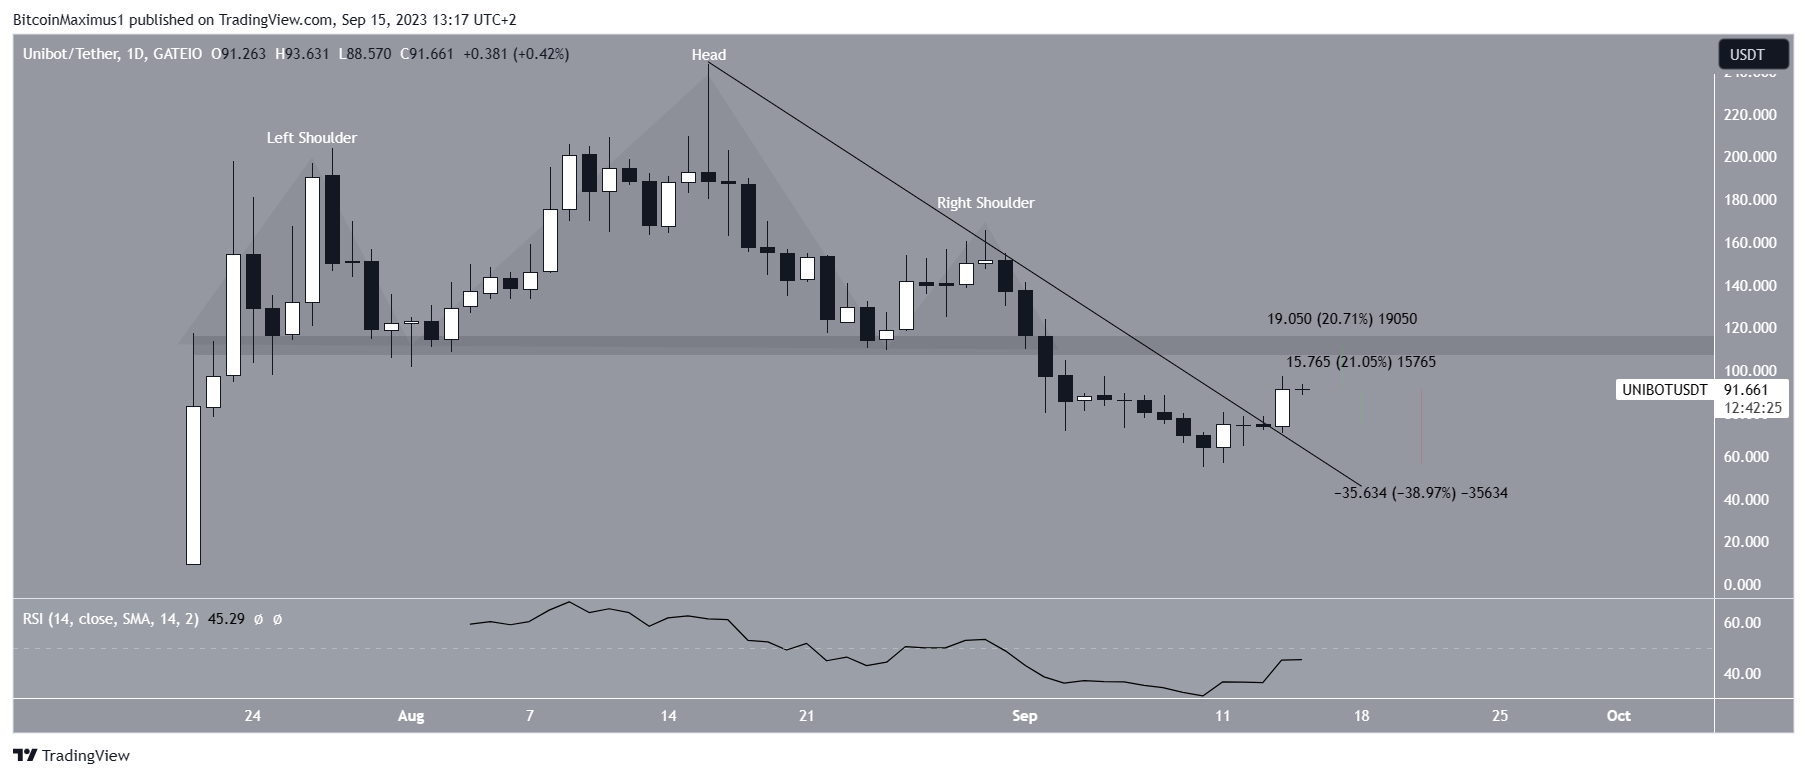
UNIBOT price has been trading within a head and shoulders formation since July 24th. The head and shoulders pattern is considered a bearish formation and often leads to breakouts. The situation was the same for UNIBOT when the formation was broken on September 2nd. The token’s breakout was swift, followed by a decline to $55 on September 10th.
However, the price has increased since then. The rise accelerated on September 14th, with a 21% increase in UNIBOT price within 24 hours. The price also broke out of a descending resistance trendline, which has been in place since August 16th, the all-time high. If the price continues to rise, the nearest resistance could be at $110, which is more than 20% above the current price. On the other hand, a reversal of the downtrend may require the price to confirm the descending resistance trendline at $55 with a 40% drop from the current price.
According to experts, the daily relative strength index (RSI) provides a mixed reading. Market investors use RSI as a momentum indicator to determine overbought or oversold conditions and decide whether an asset should be accumulated or sold. Readings above 50 indicate an ongoing uptrend and favor the bulls, while readings below 50 indicate the opposite. The indicator is still below 50 and showing a downtrend.
Expectations for Altcoin
Technical analysis on the six-hour timeframe can be in line with daily bullish expectations. The short-term chart may indicate that the price is breaking out of a short-term descending resistance trendline and a long-term resistance trendline at the same time. Additionally, the six-hour RSI is rising and above 50. Both can be signs of an uptrend. Therefore, the timeframe may indicate that UNIBOT will reach the resistance area of $110.
To confirm these indications, UNIBOT may need to clear the small horizontal resistance area at $93. Failure to surpass this $92 area, despite the price prediction, could mean that the trend is still bearish. In this case, the price may be expected to retest the descending resistance trendline at $55.

 Türkçe
 Español

