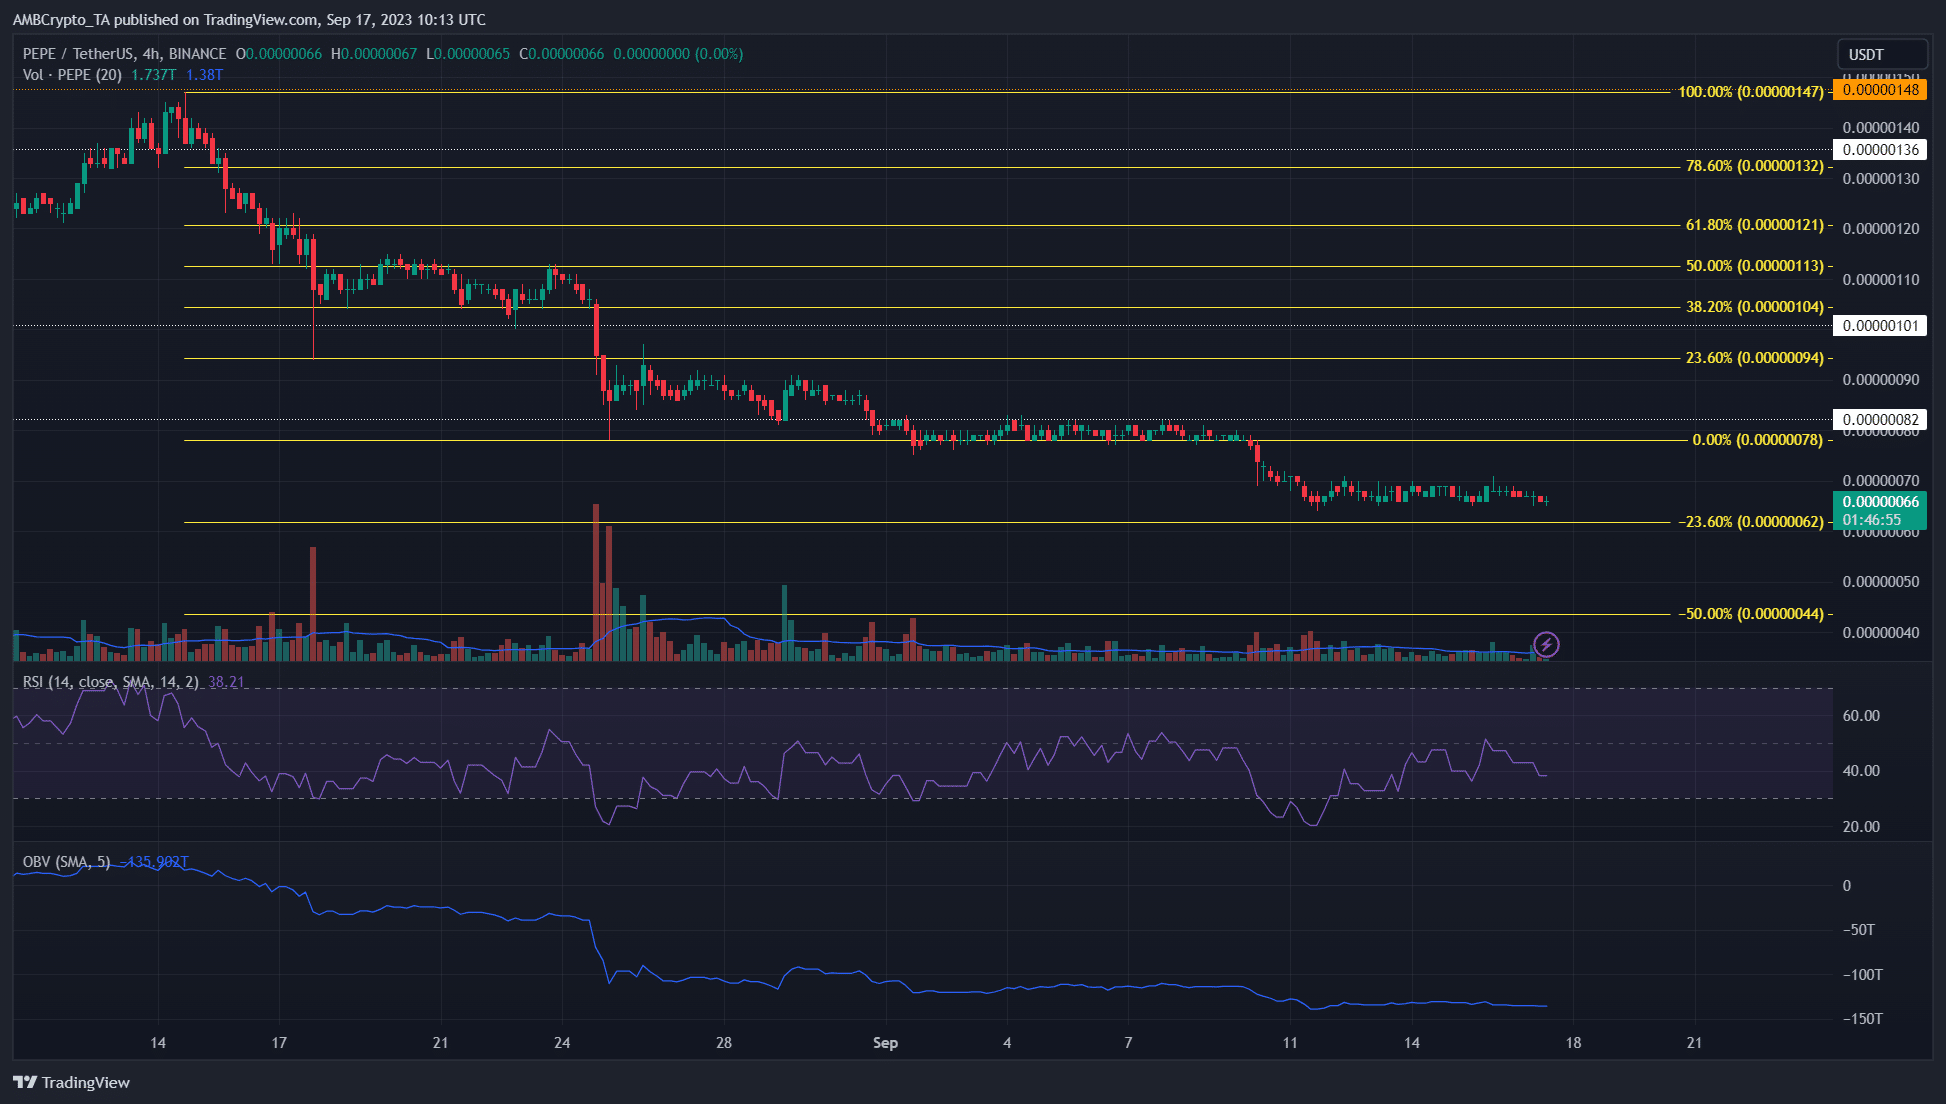
The selling pressure on Pepe Coin is quite high, and technical analysis suggests that the downtrend is unlikely to end anytime soon. The cryptocurrency experienced a momentum loss last week, but the possibility of further losses in September was high.
Uncertain Price Movement for Pepe Coin!
The price movement since August 14th indicates a decline in Pepe Coin on the charts. The market structure showed a downward trend on the 4-hour chart on August 15th. During this time, the meme token experienced a sharp drop. This downward movement was used to draw a series of Fibonacci retracement and extension levels. They revealed that the 23.6% and 50% extension levels were $0.00000062 and $0.00000044, respectively. These support levels were 6.7% and 33.7% lower than the Pepe Coin price when marked on the chart.
The market structure continued the downtrend last month, and the Relative Strength Index (RSI) also confirmed this finding. It has not surpassed the neutral 50 since August 15th, strengthening the idea of a downtrend. OBV also consistently moved in the downward direction, highlighting the lack of hope for an upward movement in the market. Coinalyze’s 1-hour chart emphasized the short-term range in which Pepe Coin traded last week. The range extended from $0.0000007 to $0.00000066.

What Does the Future Hold for Pepe Coin?
Despite the lack of a strong trend, the open position metric for the altcoin has been increasing since September 13th. This indicates that bulls may take early action, but it is uncertain whether they will lead to a price increase. Investors may consider entering short positions if there is a jump to the $0.00000074-0.00000078 range.
In conclusion, Pepe Coin continues the downtrend with high selling pressure and technical indicators. Since August 14th, the price has been declining, with Fibonacci levels serving as support, and the price could experience further drops between 6.7% and 33.7%. The Relative Strength Index (RSI) and On-Balance Volume (OBV) support the downtrend.


