COINTURK NEWSCOINTURK NEWSCOINTURK NEWS
  • Crypto Tracker App
  • Bitcoin
  • Altcoin
  • Ethereum
  • Advertise
  • Contact
  • TURTURTUR
  • ESESES
Search
© 2024 COINTURK NEWS. All Rights Reserved.
Reading: Bitcoin’s Historical Cycles: A Comparison of 2017 and 2023 Graphs
Share
Font ResizerAa
COINTURK NEWSCOINTURK NEWS
Font ResizerAa
Search
  • Crypto Tracker App
  • Bitcoin
  • Altcoin
  • Ethereum
  • Advertise
  • Contact
  • TURTURTUR
  • ESESES
Follow US
© 2025 >> COINTURK NEWS
Powered by LK SOFTWARE
COINTURK NEWS > Bitcoin (BTC) > Bitcoin’s Historical Cycles: A Comparison of 2017 and 2023 Graphs
Bitcoin (BTC)

Bitcoin’s Historical Cycles: A Comparison of 2017 and 2023 Graphs

In Brief

  • When you examine the Bitcoin charts according to the years, you can see that certain movements repeat themselves. However, historical data does not always provide accurate information. If past experiences were to give us definite truths, then in November of last year, the price of BTC would not have dropped below the previous all-time high […]
COINTURK NEWS
COINTURK NEWS 3 years ago
Share
SHARE

When you examine the Bitcoin charts according to the years, you can see that certain movements repeat themselves. However, historical data does not always provide accurate information. If past experiences were to give us definite truths, then in November of last year, the price of BTC would not have dropped below the previous all-time high (ATH) level of $20,000. Abnormal conditions yield unusual results.

Contents
Bitcoin Historical Data2017 and 2023 Bitcoin Graph

Bitcoin Historical Data

Bitcoin (BTC) price jumped last week, ending the consolidation movement that has been going on for about a month. However, BTC has not yet managed to break out of a significant downward resistance line. We cannot say that the downtrend has clearly reversed because it has not achieved this.

The ongoing BTC decline since the all-time high in November 2021 shares an interesting similarity with what happened after the highest level of 2017. In both periods, the king cryptocurrency reached its bottom point 12 months later. Additionally, a temporary decrease below 50 was indicated by the RSI before the final increase above 50.

2017 and 2023 Bitcoin Graph

In the previous bull season, BTC initiated a rally that lasted for 180 days and brought about a 340% increase. Then, it underwent a correction of 70% within a period of 270 days before starting the next cycle. During that period, the price did not close below the $6,500 horizontal support. In the current cycle, the price of Bitcoin entered a much more gradual upward trend and reached the highest level of 2023 in July, with a 100% increase within a 240-day period.

If the movement in 2017 is repeated, the price should remain in a downtrend until the end of the year. The upcoming news flow, including FTX’s upcoming $500 million BTC sale, SilkRoad, and MtGox liquidations, seems to support this scenario.

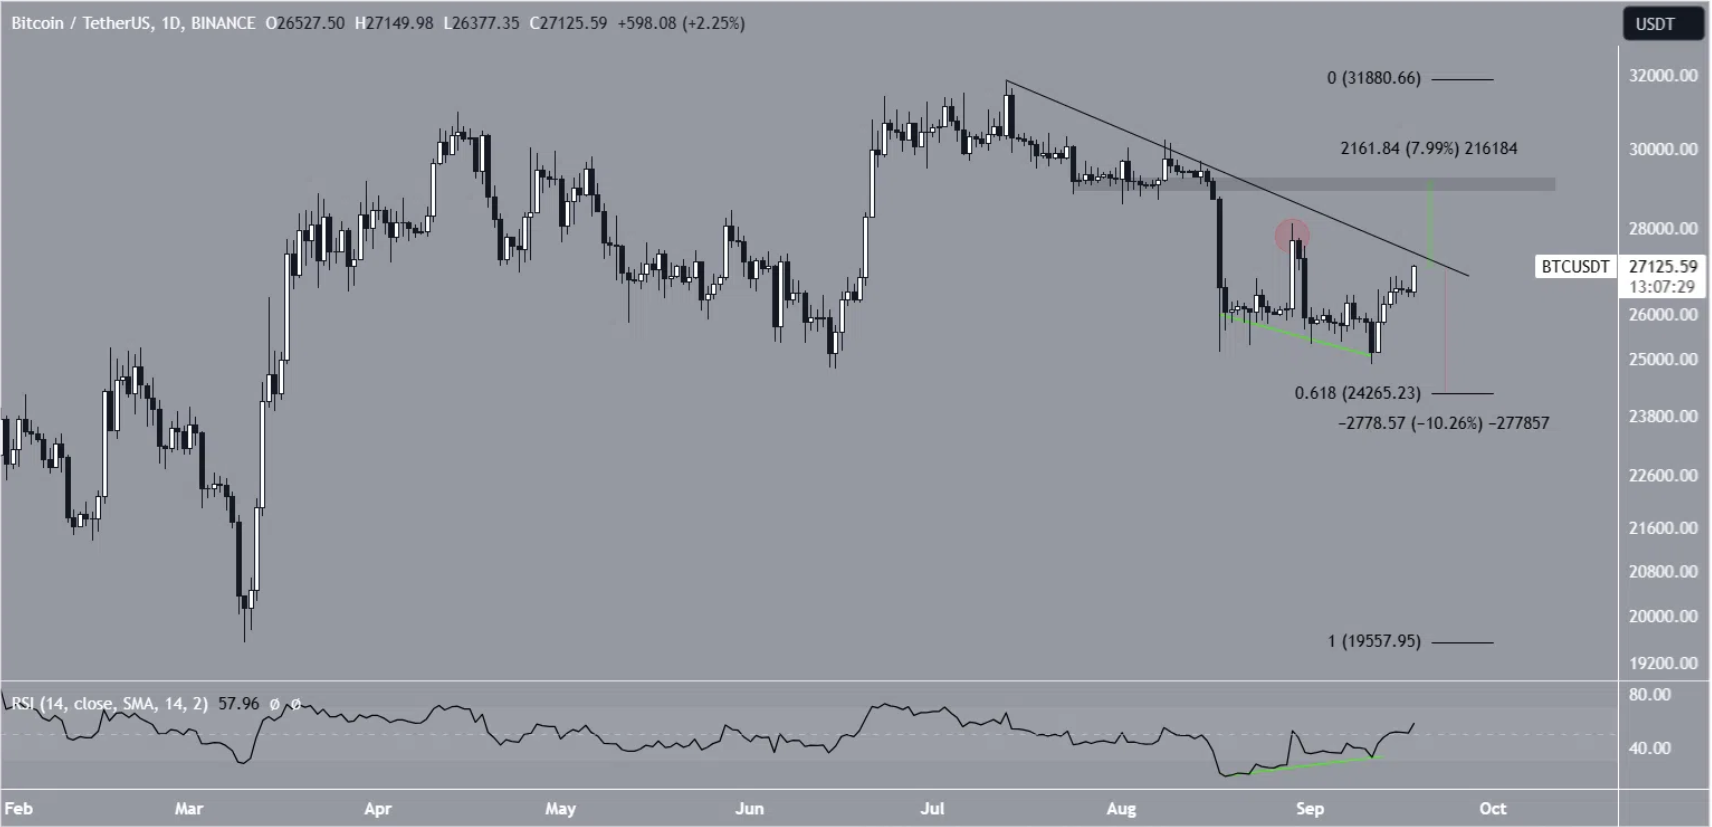
If the BTC price deviates from the line, it could reach the next resistance at $29,200. This declining resistance line continues to be challenging for the bulls. The resistance area is more than 10% above the current price. On the other hand, the inability to sustain the increase could pave the way for a new decline towards $24,300. Whether this line will be broken or not seems to determine the trajectory of the price.

You can follow our news on X, Telegram, Facebook & Coinmarketcap
Disclaimer: The information contained in this article does not constitute investment advice. Investors should be aware that cryptocurrencies carry high volatility and therefore risk, and should conduct their own research.

You Might Also Like

Michael Saylor said institutional demand now drives Bitcoin, ending the four year cycle

BIP 110 support drops below 10 percent and canceled! What does this mean for Bitcoin’s future?

FARTCOIN trades at $0.1635 as analysts say Bitcoin’s direction could push price to $0.22 or even $0.50

Analysts highlight rare bullish signals in Bitcoin, $65,400 target emerges

Spot Bitcoin ETFs saw $221 million inflow on June 2, ending 10-day outflow streak

COINTURK NEWS 18 September, 2023 - 7:25 pm 18 September, 2023 - 7:25 pm
Share This Article
Facebook Twitter
Share
Previous Article The Rise of Bitcoin and Altcoins Amid Regulatory Pressure
Next Article SEC’s Lawsuit Against Binance: Latest Developments and Concerns
Leave a comment

Leave a Reply Cancel reply

Your email address will not be published. Required fields are marked *

This site uses Akismet to reduce spam. Learn how your comment data is processed.

Stay Connected

8.1k Like
21.1k Follow
1.1k Follow

Latest News

A new buy signal appears in Solana after a 74% drop! What are investors watching now?
Solana (SOL)
Michael Saylor said institutional demand now drives Bitcoin, ending the four year cycle
Bitcoin (BTC)
Shiba Inu failed to hold above $0.000005 as selling pressure increased near key resistance
Shiba (SHIB)
//

COINTURK was launched in March 2014 by a group of technology enthusiasts who believe that Bitcoin will be as important as the internet in the world of the future thanks to the amazing technology underlying it.

CRYPTOCURRENCY LIVE PRICES

  • Bitcoin (BTC) Live Price
  • Ethereum (ETH) Live Price
  • Ripple (XRP) Live Price
  • Solana (SOL) Live Price
  • Dogecoin (DOGE) Live Price
  • Cardano (ADA) Live Price
  • Chainlink (LINK) Live Price

OUR PARTNERS

  • COINMARKETCAP
  • COINGECKO
  • BITCOINHABER
  • BH NEWS
  • 21MILYON
  • NEWSLINKER

OUR COMPANY

  • About Us
  • Cookie Policy
  • Advertising
  • Contact
COINTURK NEWSCOINTURK NEWS
Follow US
COINTURK NEWS 2026
Powered by LK SOFTWARE
Welcome Back!

Sign in to your account

Lost your password?