Hedera (HBAR) price has surpassed its long and short-term resistance trendline. It experienced a sharp increase on August 14th. According to experts, the price movement from multiple timeframes and indicator readings may indicate a continuing upward trend that supports the ongoing rise. So, what are the expectations for this cryptocurrency?
HBAR Price Analysis!
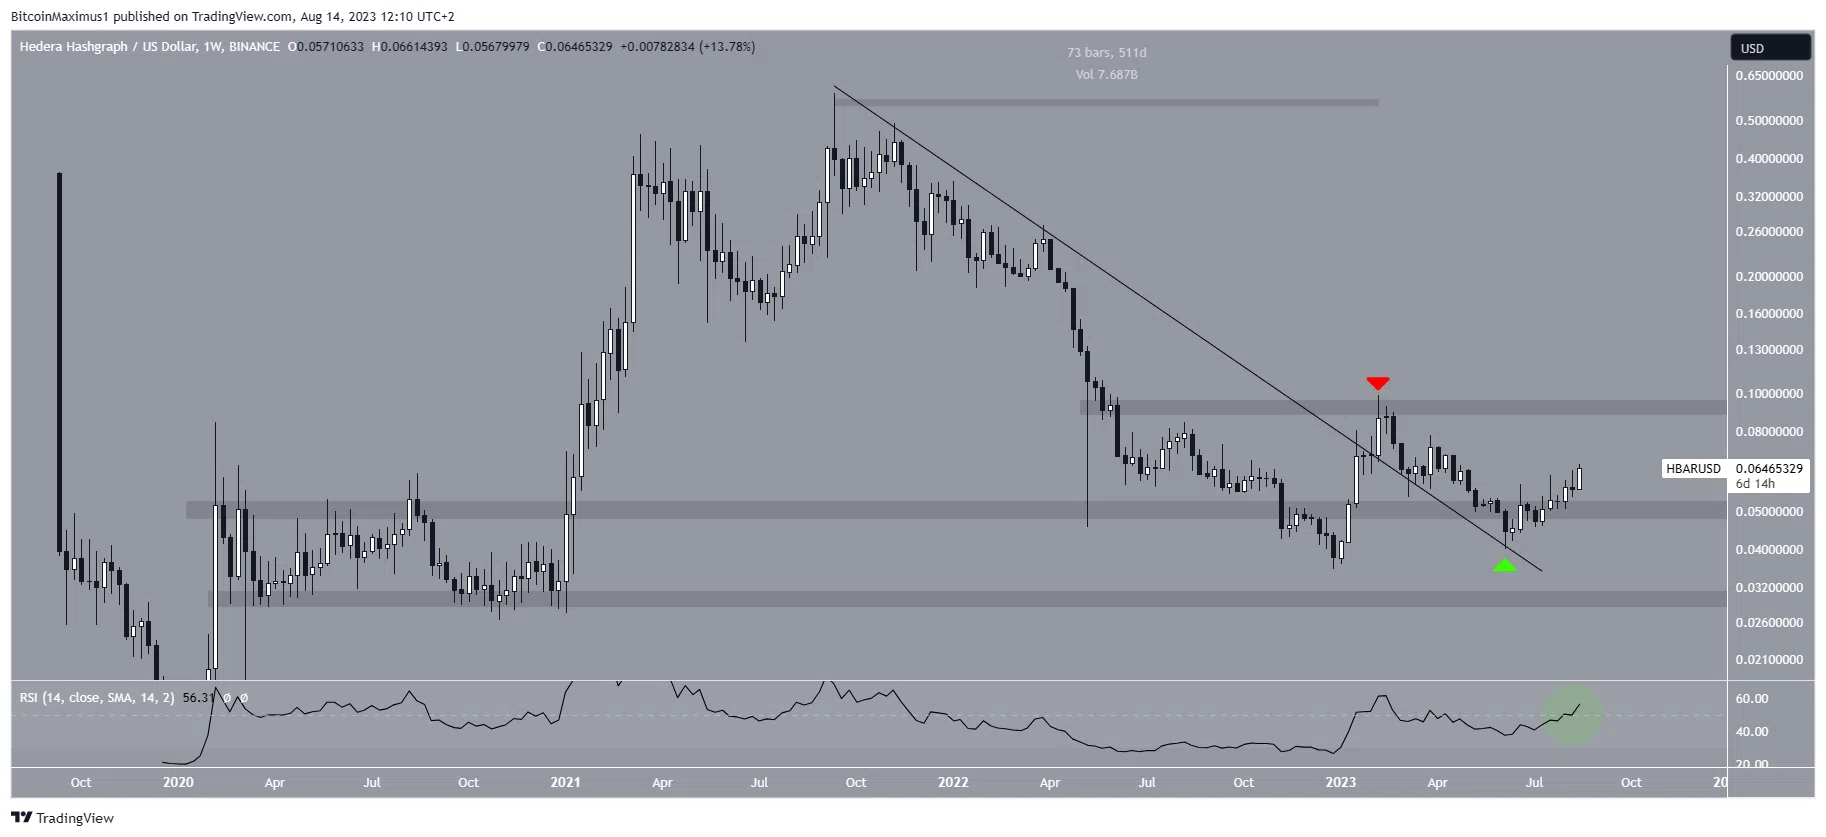
HBAR price broke out of a 511-day resistance trendline at the beginning of February. The broken line had been in effect since the all-time high of $0.584 in September 2021. The price increase can possibly be attributed to the recent move by the US Federal Reserve to include Dropp in FedNow, leveraging Hedera’s technology for faster micro-payments.
Departures from such long-term structures can indicate the completion of the previous correction and the beginning of a new movement in the opposite direction. However, HBAR couldn’t sustain its increase. Instead, it was rejected by the horizontal resistance area of $0.090 during the breakout week. It then dropped to $0.040 in June, confirming the line as support. The price started to rise afterward and has been increasing since then. HBAR is currently trading above the horizontal area of $0.050, which is expected to act as support.
The Future of HBAR Coin!
Weekly RSI supports the continuation of the increase. RSI is a momentum indicator used by investors to assess whether a market is overbought or oversold and decide whether to accumulate or sell a token. Readings above 50 and an upward trend indicate that bulls are still favored, while readings below 50 indicate the opposite.
RSI is rising and above 50, both of which can be seen as signs of an upward trend. This situation may indicate that the increase will continue to the next resistance at $0.090. Technical analysis on the daily timeframe may align with the upward trend on the weekly timeframe, and there are two main reasons for this.
Firstly, HBAR price broke out of a shorter-term descending resistance trendline on June 20th. Secondly, the price rose above the horizontal resistance area of $0.057 and then confirmed it as support. The daily RSI is also above 50 and rising, indicating an upward trend. According to analysts, although there is a small resistance at $0.074, these bullish signs indicate that the HBAR price will likely surpass it and reach the resistance area of $0.090. The analysts’ forecast represents a 40% increase from the current price.

 Türkçe
 Español

