So far this week, many cryptocurrencies in the altcoin market have reached new milestones and attracted attention with an upward trend. JasmyCoin (JASMY), Wormhole (W), and Toncoin (TON) are among the altcoin projects that have achieved the highest gains in the past seven days. What do the chart analyses say for these altcoins? Let’s examine together.
Jasmy Chart Analysis
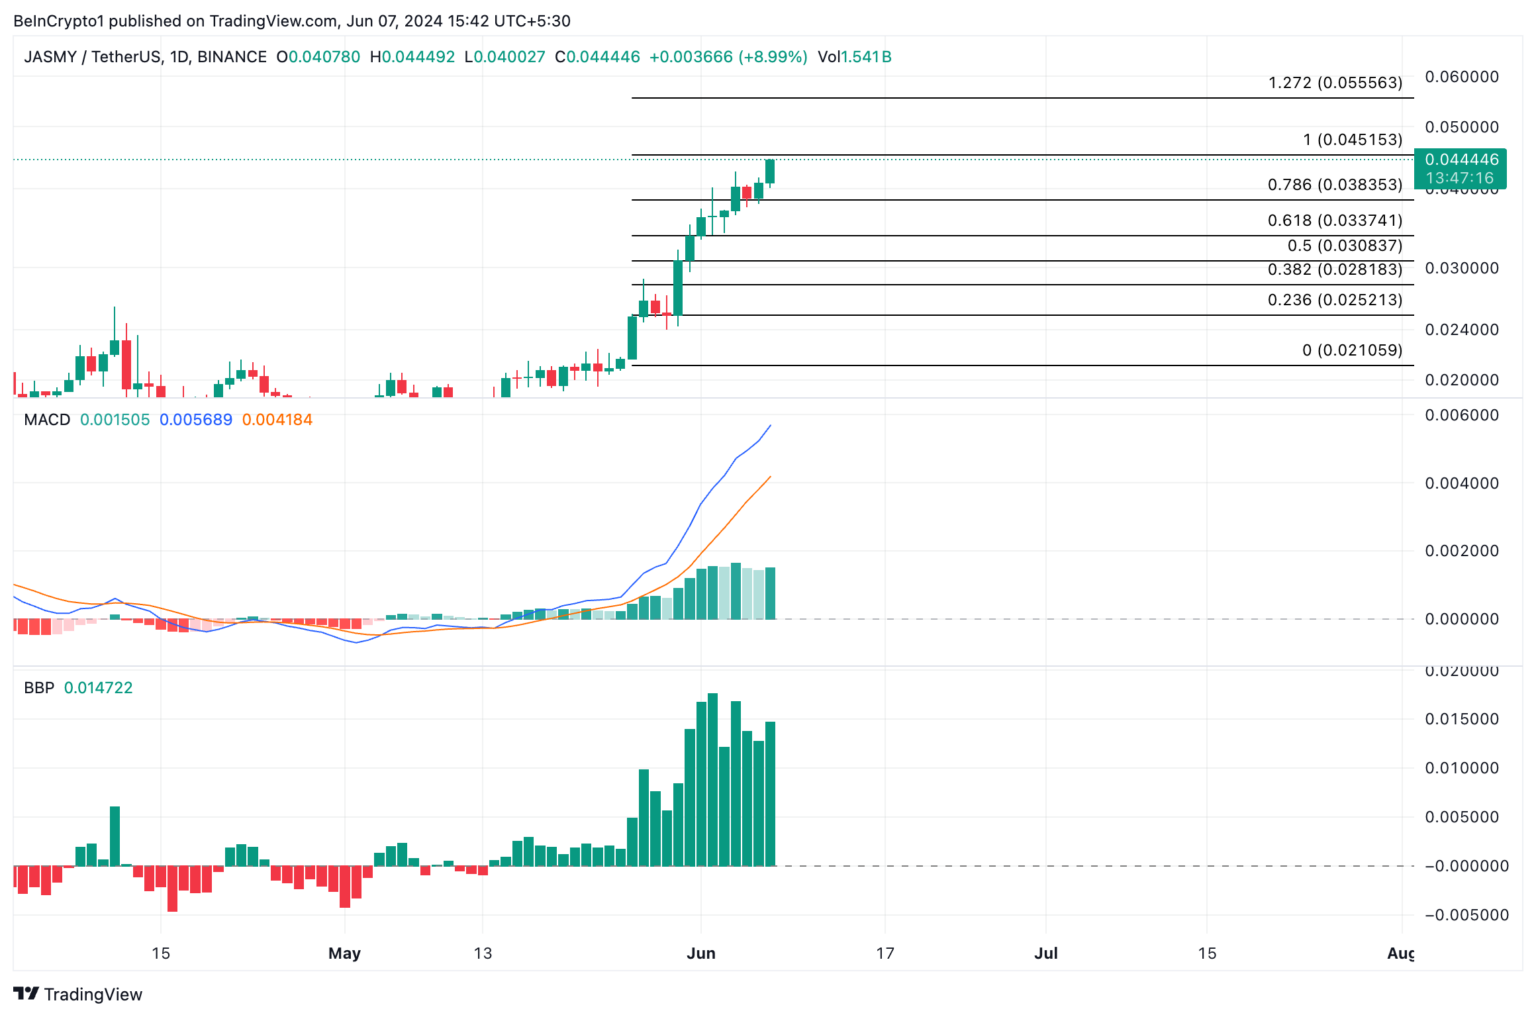
In the past seven days, the price per JasmyCoin (JASMY) increased by 46%. At the time of writing, the altcoin is trading at $0.043, a price level last observed in March 2022. After a long trend period within a specific range with relative balance between buying and selling pressures, the bulls prevailed on May 14.
JASMY’s Elder-Ray Index confirmed this by returning positive values (marked with green bars) since then. This indicator defines the direction of an asset’s price trends and potential buying or selling opportunities in the market. When its value is positive, it signals an upward trend, indicating that token accumulation has surpassed distribution.
Additionally, the MACD line (orange) was shown to be positioned above the signal (blue) and zero lines. If this trend continues, JSMY’s value could rise to $0.055, the price last seen on March 18, 2022, but if buyers exhaust, the token’s value could drop to $0.058.

Wormhole Chart Analysis
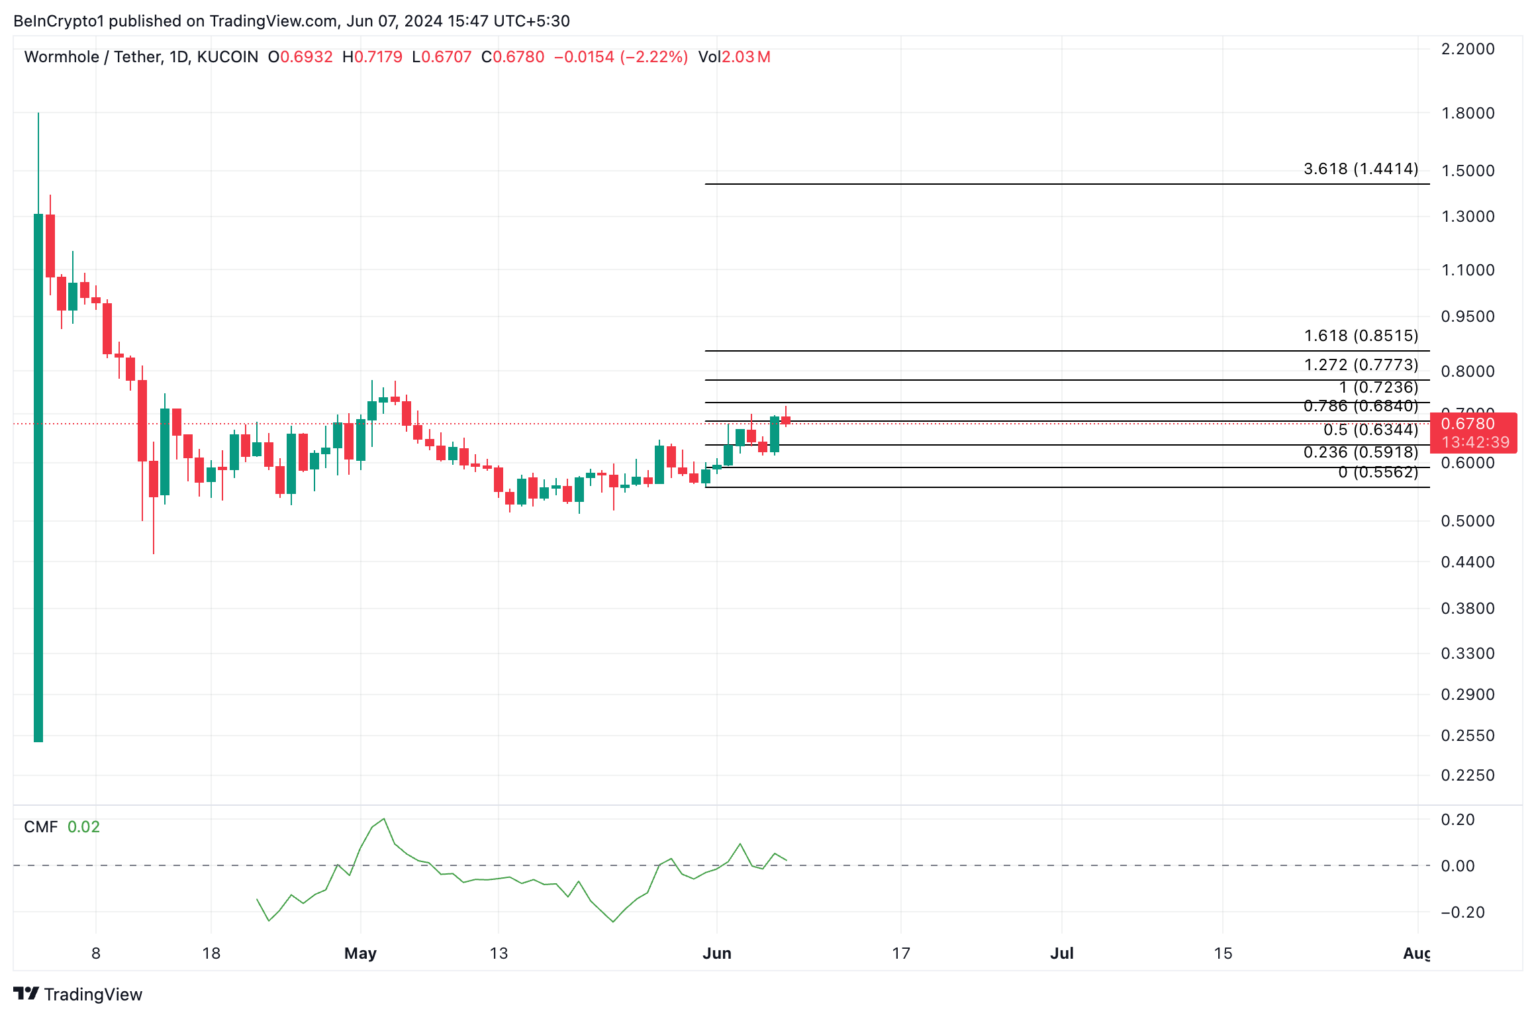
The value of Wormhole’s native token W increased by 30% in the past seven days. During this period, the token’s daily trading volume also saw a significant increase. For example, at the time of publication, W’s trading volume reached $238 million, the highest level in 30 days.
W’s positive Chaikin Money Flow (CMF) supports the above point, confirming the increase in capital flow into the W market. As of the time of writing, the indicator’s value was 0.03. If this continues, W could trade at $0.68, but if invalidated, it will drop to $0.63.

TON Chart Analysis
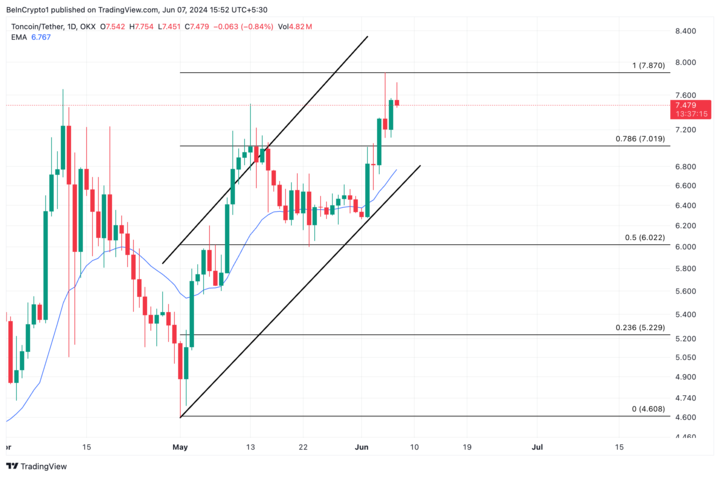
Toncoin (TON), which rose by 16% in the past seven days, is trying to break above the upper line of its ascending channel. It has been trending in this channel since May 2. An ascending channel forms when an asset’s price reaches consistently higher highs and higher lows over a period. The channel typically indicates a bullish trend, suggesting that buyers are in control and the asset’s price is likely to continue rising.
TON trading above its 20-day Exponential Moving Average gives confidence. This moving average tracks an asset’s average price over the past 20 days. Trading above this level means the asset’s current value is higher than its average price over the past 20 days. This bullish sign indicates that buying activity is higher than selling pressure.
If TON bulls maintain this trend, the token price could exceed $7.74 and rise towards the all-time high of $7.80, but if they fail and bears regain control, selling pressure could drop the altcoin’s value to $7.01.


 Türkçe
 Español


