October 26 saw a decline in the cryptocurrency markets. However, the fears of recent geopolitical issues reaching a critical level and the positive news flow in the crypto markets have brought smiles to the faces of many investors, especially Bitcoin investors. So, what’s happening with Binance Coin, Cardano, and Tron, which investors are closely monitoring? Let’s take a closer look.
Binance Coin Chart Analysis
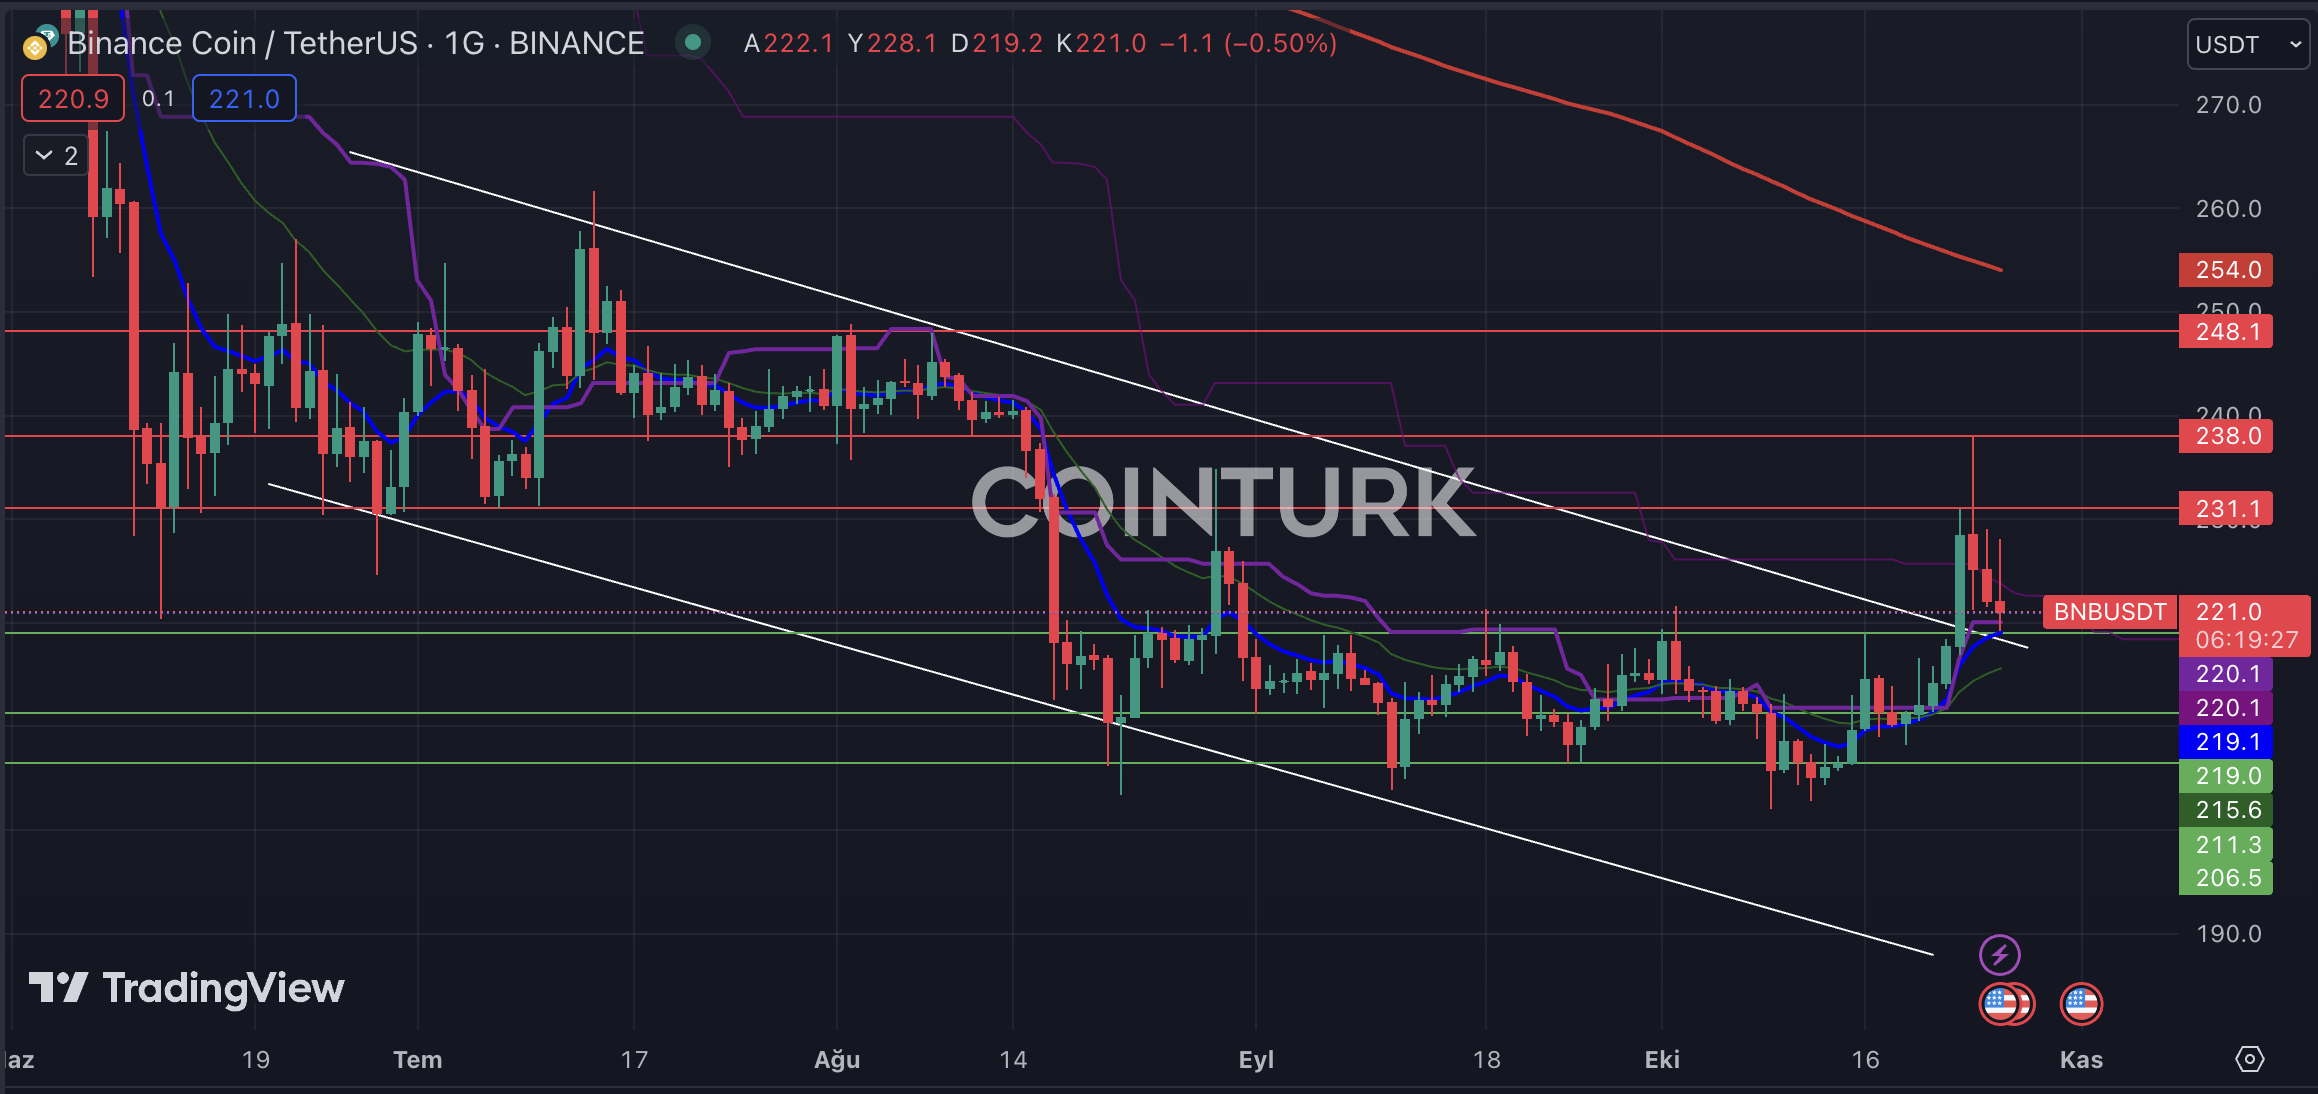
The first notable formation in the daily chart of BNB is the descending channel pattern. However, with the recent breakout due to the impact of the latest uptrend, a resistance breakout occurred. If BNB can gain strength from the support line, a significant upward movement can be triggered.
The notable support levels for BNB in the daily chart are 219 / 211.3 and 206.5 dollars, respectively. Especially, if the daily bar closes below the 219 dollar level, it will cause a return to the formation structure and accelerate the decline for BNB. The resistance levels for BNB are 231, 238, and 248.1 dollars.

Cardano Chart Analysis
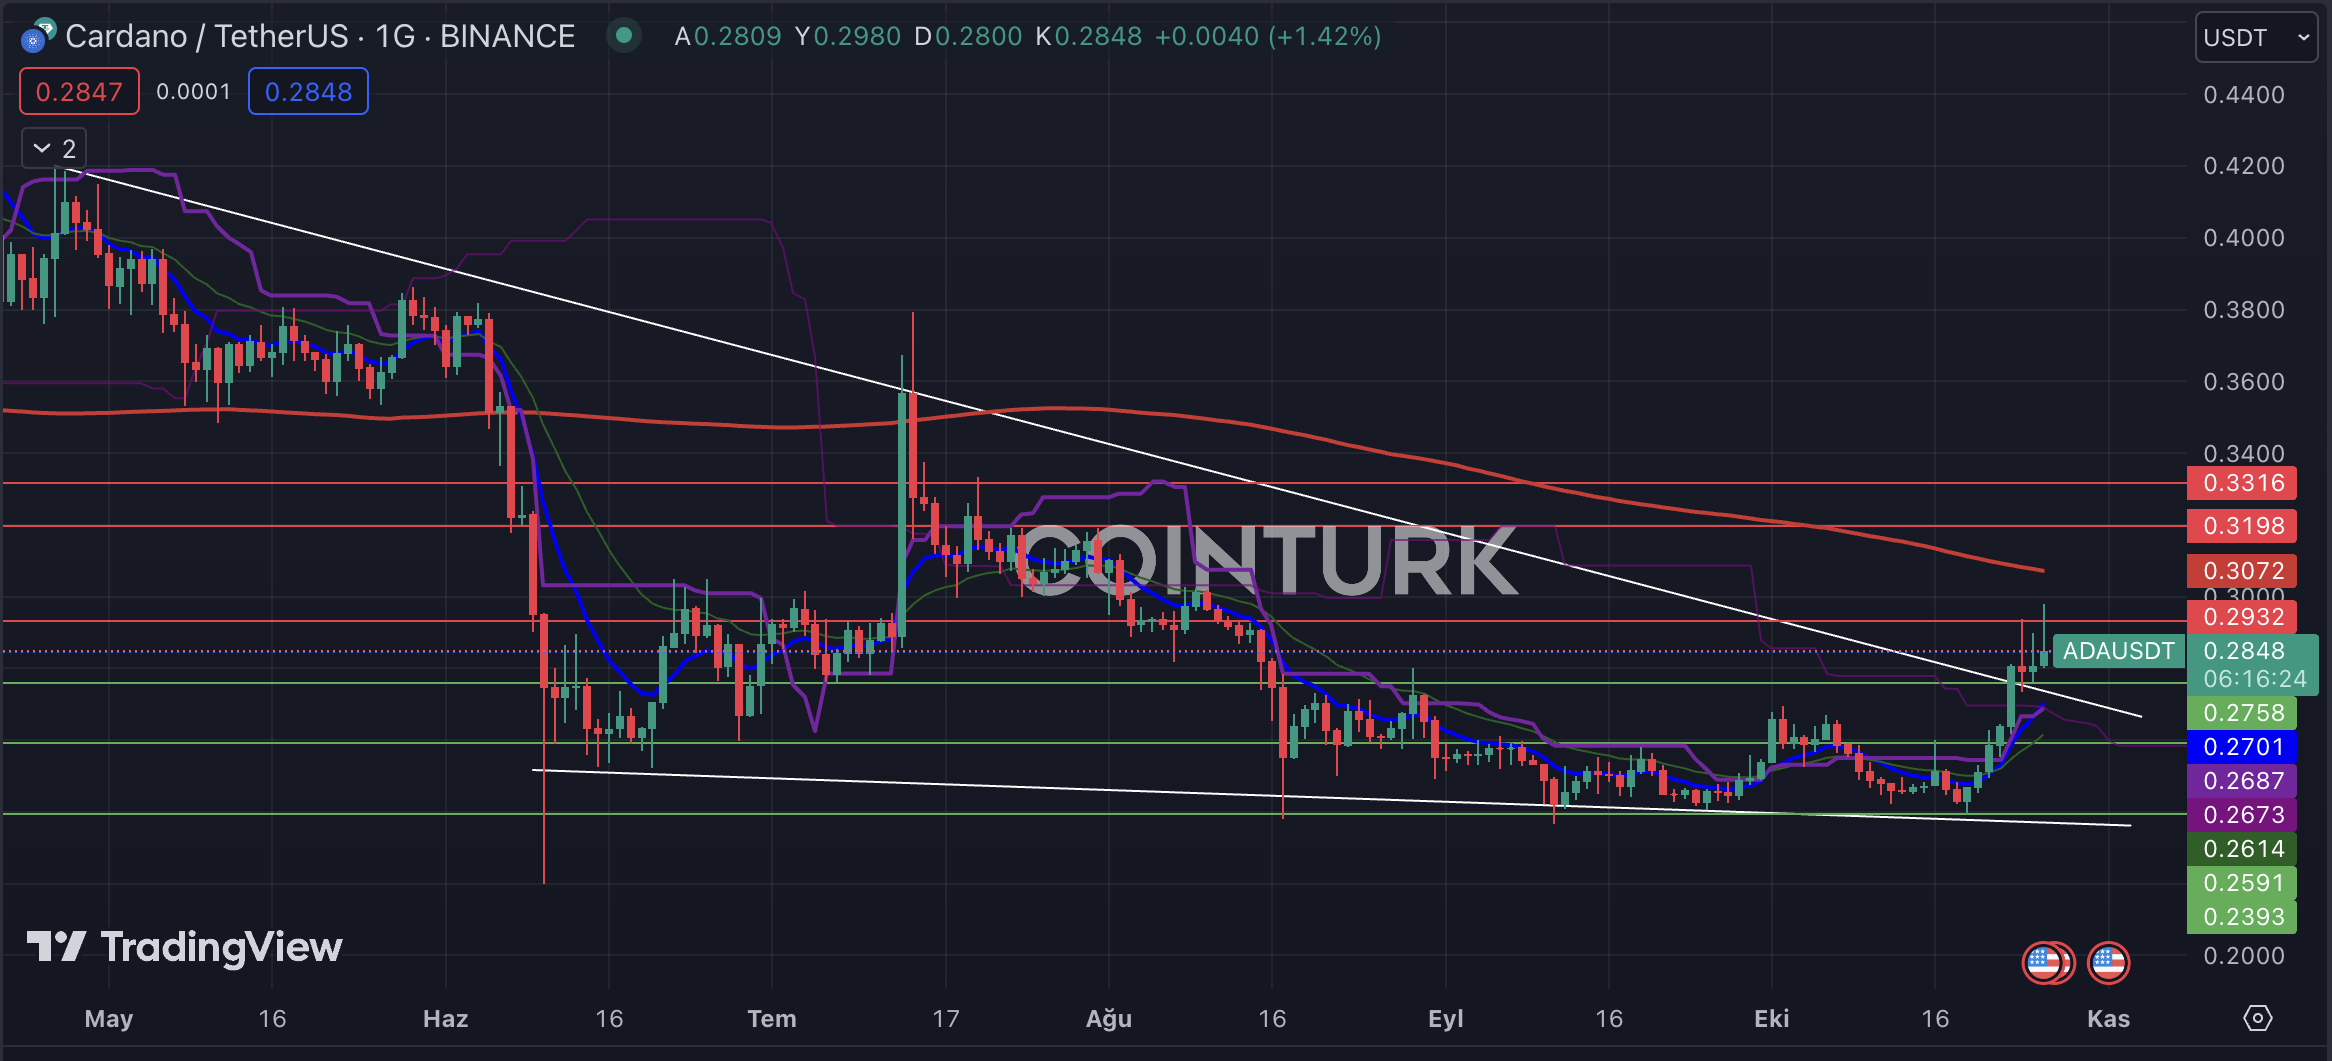
The first notable thing in ADA‘s daily chart is the breakout of the descending trend line. In this structure, if the line, which has been working as resistance for months, acts as support, it can ignite the rise. The breakout of the EMA 200 level, which served as resistance in the recent uptrend, will increase the likelihood of a rally.
The important support levels for ADA are 0.2758 / 0.2591 and 0.2393 dollars, respectively. Especially, if the daily bar closes below the 0.2758 dollar level, it will reduce the possibility of an upward movement. The resistance levels to be followed for ADA are 0.2932, 0.3198, and 0.3316 dollars.

Tron Chart Analysis
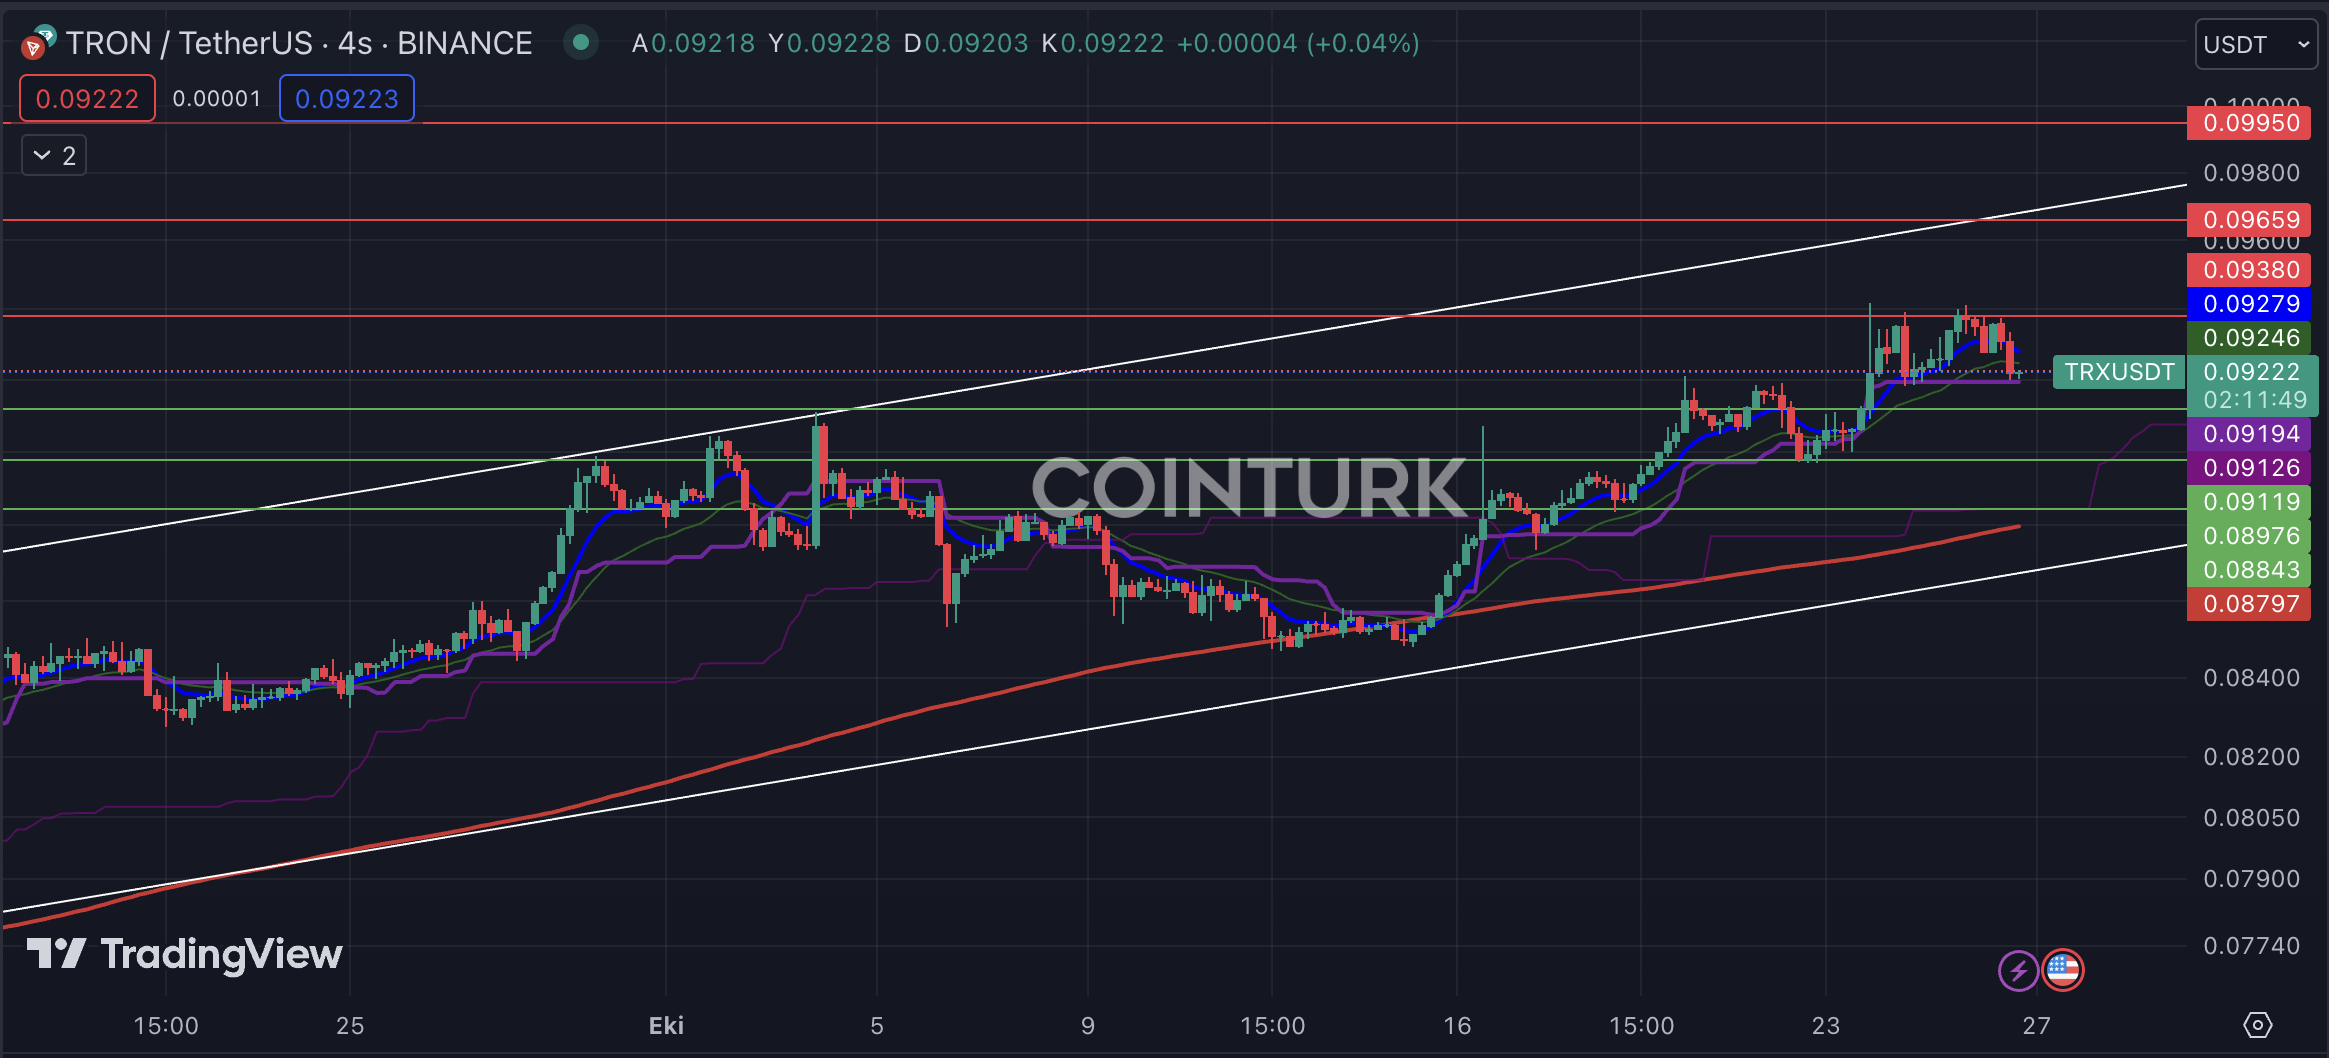
The first notable formation in the four-hour chart of TRX is the ascending channel pattern. However, the resistance level that has not been broken despite many attempts since October 23 may weaken TRX and lead to an increase in selling transactions by investors. The price falling below the EMA 7 and EMA 21 levels brings another negative scenario to the table.
The important support levels for TRX are 0.09119 / 0.08976 and 0.08843 dollars, respectively. A breakout below these levels will not bring a short-term decline possibility to TRX. The resistance levels to be followed for TRX are 0.09380, 0.09659, and 0.09950 dollars.


