This week, Bitcoin‘s price experienced a minor pullback, but the price reaching the level of $44,000 within the day indicated that the bulls were not rushing to close their positions. Naturally, the developments on the Bitcoin front continue to positively impact the altcoin market. So, what do the BNB, ADA, and LINK charts tell us? Let’s examine together.
BNB Chart Analysis
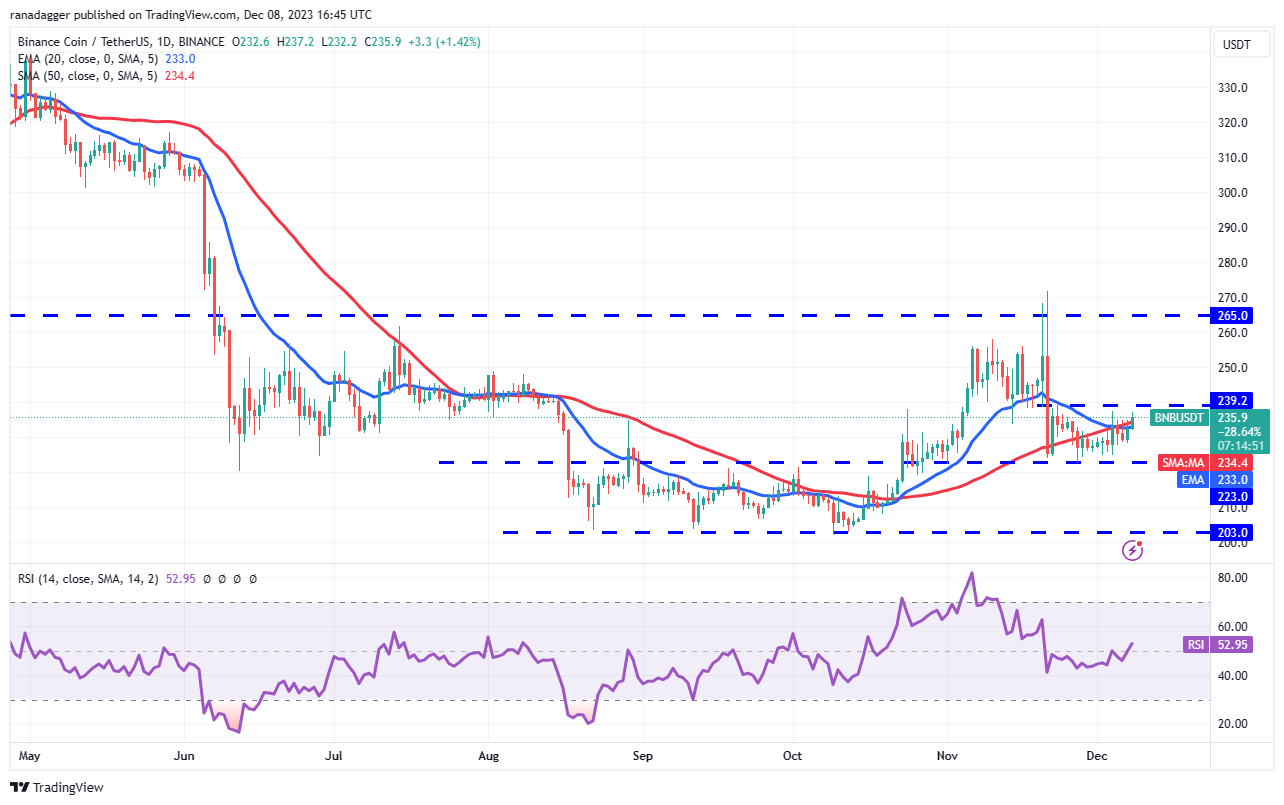
BNB is stuck in the range of $223 to $239, indicating a balance between supply and demand. Investors have pushed the price above the 20-day EMA level of $233 and are trying to overcome the hurdle at the $239 level.
If successful, the BNB/USDT pair is expected to gain momentum and leap towards the hurdle seen at the $265 level. A break and close above this level will successfully complete a bullish inverse head and shoulder formation. This optimistic view will be invalidated in the short term if the price drops and falls below $223. This could drop the pair to the critical support of $203.

ADA Chart Analysis
Cardano has been on the rise since it closed above the $0.40 resistance on December 4th. Investors managed to push the price above $0.46 with the increase on December 7th and followed this with another move above $0.52 on December 8th.
The next level to watch on the upside is $0.60, but the overbought zone in the RSI level indicates that a small correction or consolidation is possible in the short term. If the bulls manage to hold at the current level, it increases the possibility of the price rising to $0.70.
Conversely, if the ADA/USDT pair turns down from the current level, it is likely to find support at $0.52 and then again at $0.46. A drop below this support will pave the way for a possible fall to the 20-day EMA level of $0.41.

LINK Chart Analysis
Chainlink received support from the 20-day EMA level of $15.04 on December 7th, showing that sentiment remains positive and investors are buying on dips. The bulls continued their purchases on December 8th, managing to push the price above the $16.60 resistance. If the buyers maintain the rise, it indicates that the uptrend has resumed. The LINK/USDT pair could leap to $18.30 and then the $19.50 level.
If the price falls and closes below $16.60, we may see the bears active at higher levels. This will increase the likelihood of falling below the 20-day EMA level. This could result in the LINK price falling to $13.


 Türkçe
 Español


