Türkçe
 Español


With recent developments, the price of Bitcoin has been trapped in a narrow range and volatility has dropped to unprecedented levels. The reasons for this can be summarized as the inflation crisis in the US and worldwide, pressure from the US SEC, and cryptocurrency regulations in developed countries. In this article, we will examine two different Bitcoin charts and determine the support and resistance levels that need to be followed in both the short and long term.
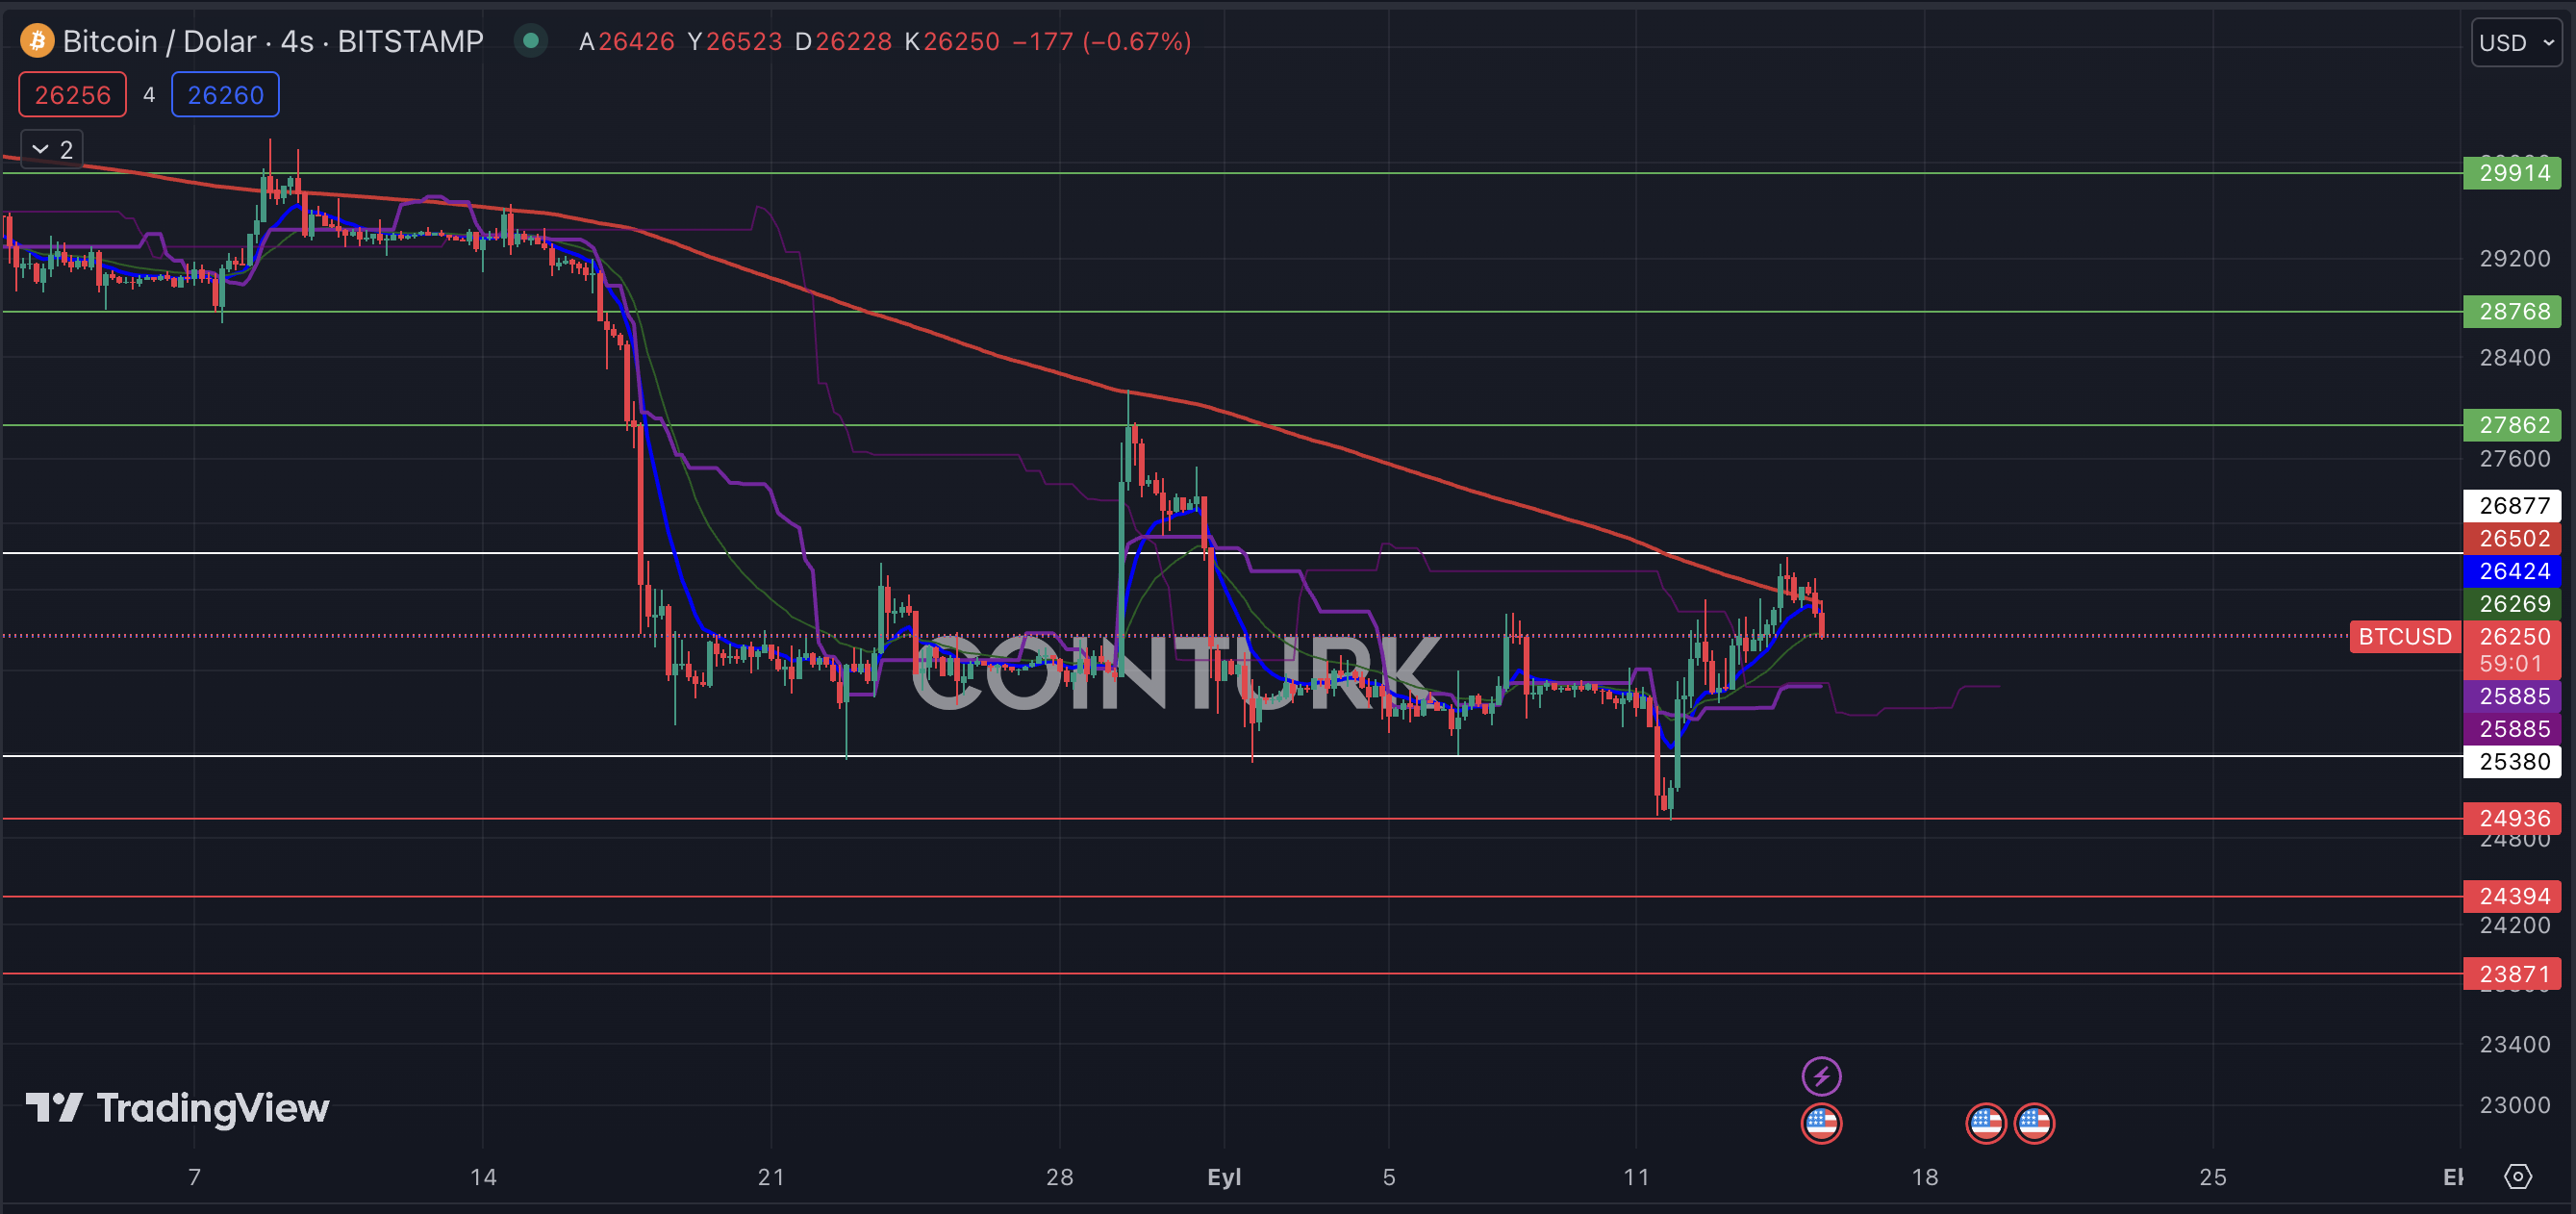
Bitcoin 4-Hour Chart Analysis
The first noticeable aspect in the 4-hour chart analysis of Bitcoin is the price being trapped between $25,380 and $26,877. News such as the Grayscale case has caused a short-term increase in the price of Bitcoin, but Bitcoin could not hold these levels. The resistance function of the EMA 200 average in three different zones in the last month on the 4-hour chart is causing a negative situation for the Bitcoin price.
The resistance levels that need to be monitored for Bitcoin in the short term are $25,380, $24,936, and $24,394, respectively. Breaking the $25,380 level can cause a significant decrease, but it would be healthier to wait for a daily close below this level due to the bear trap that occurred on September 11. The resistance levels that need to be followed are $26,877, $27,862, and $28,768, respectively.
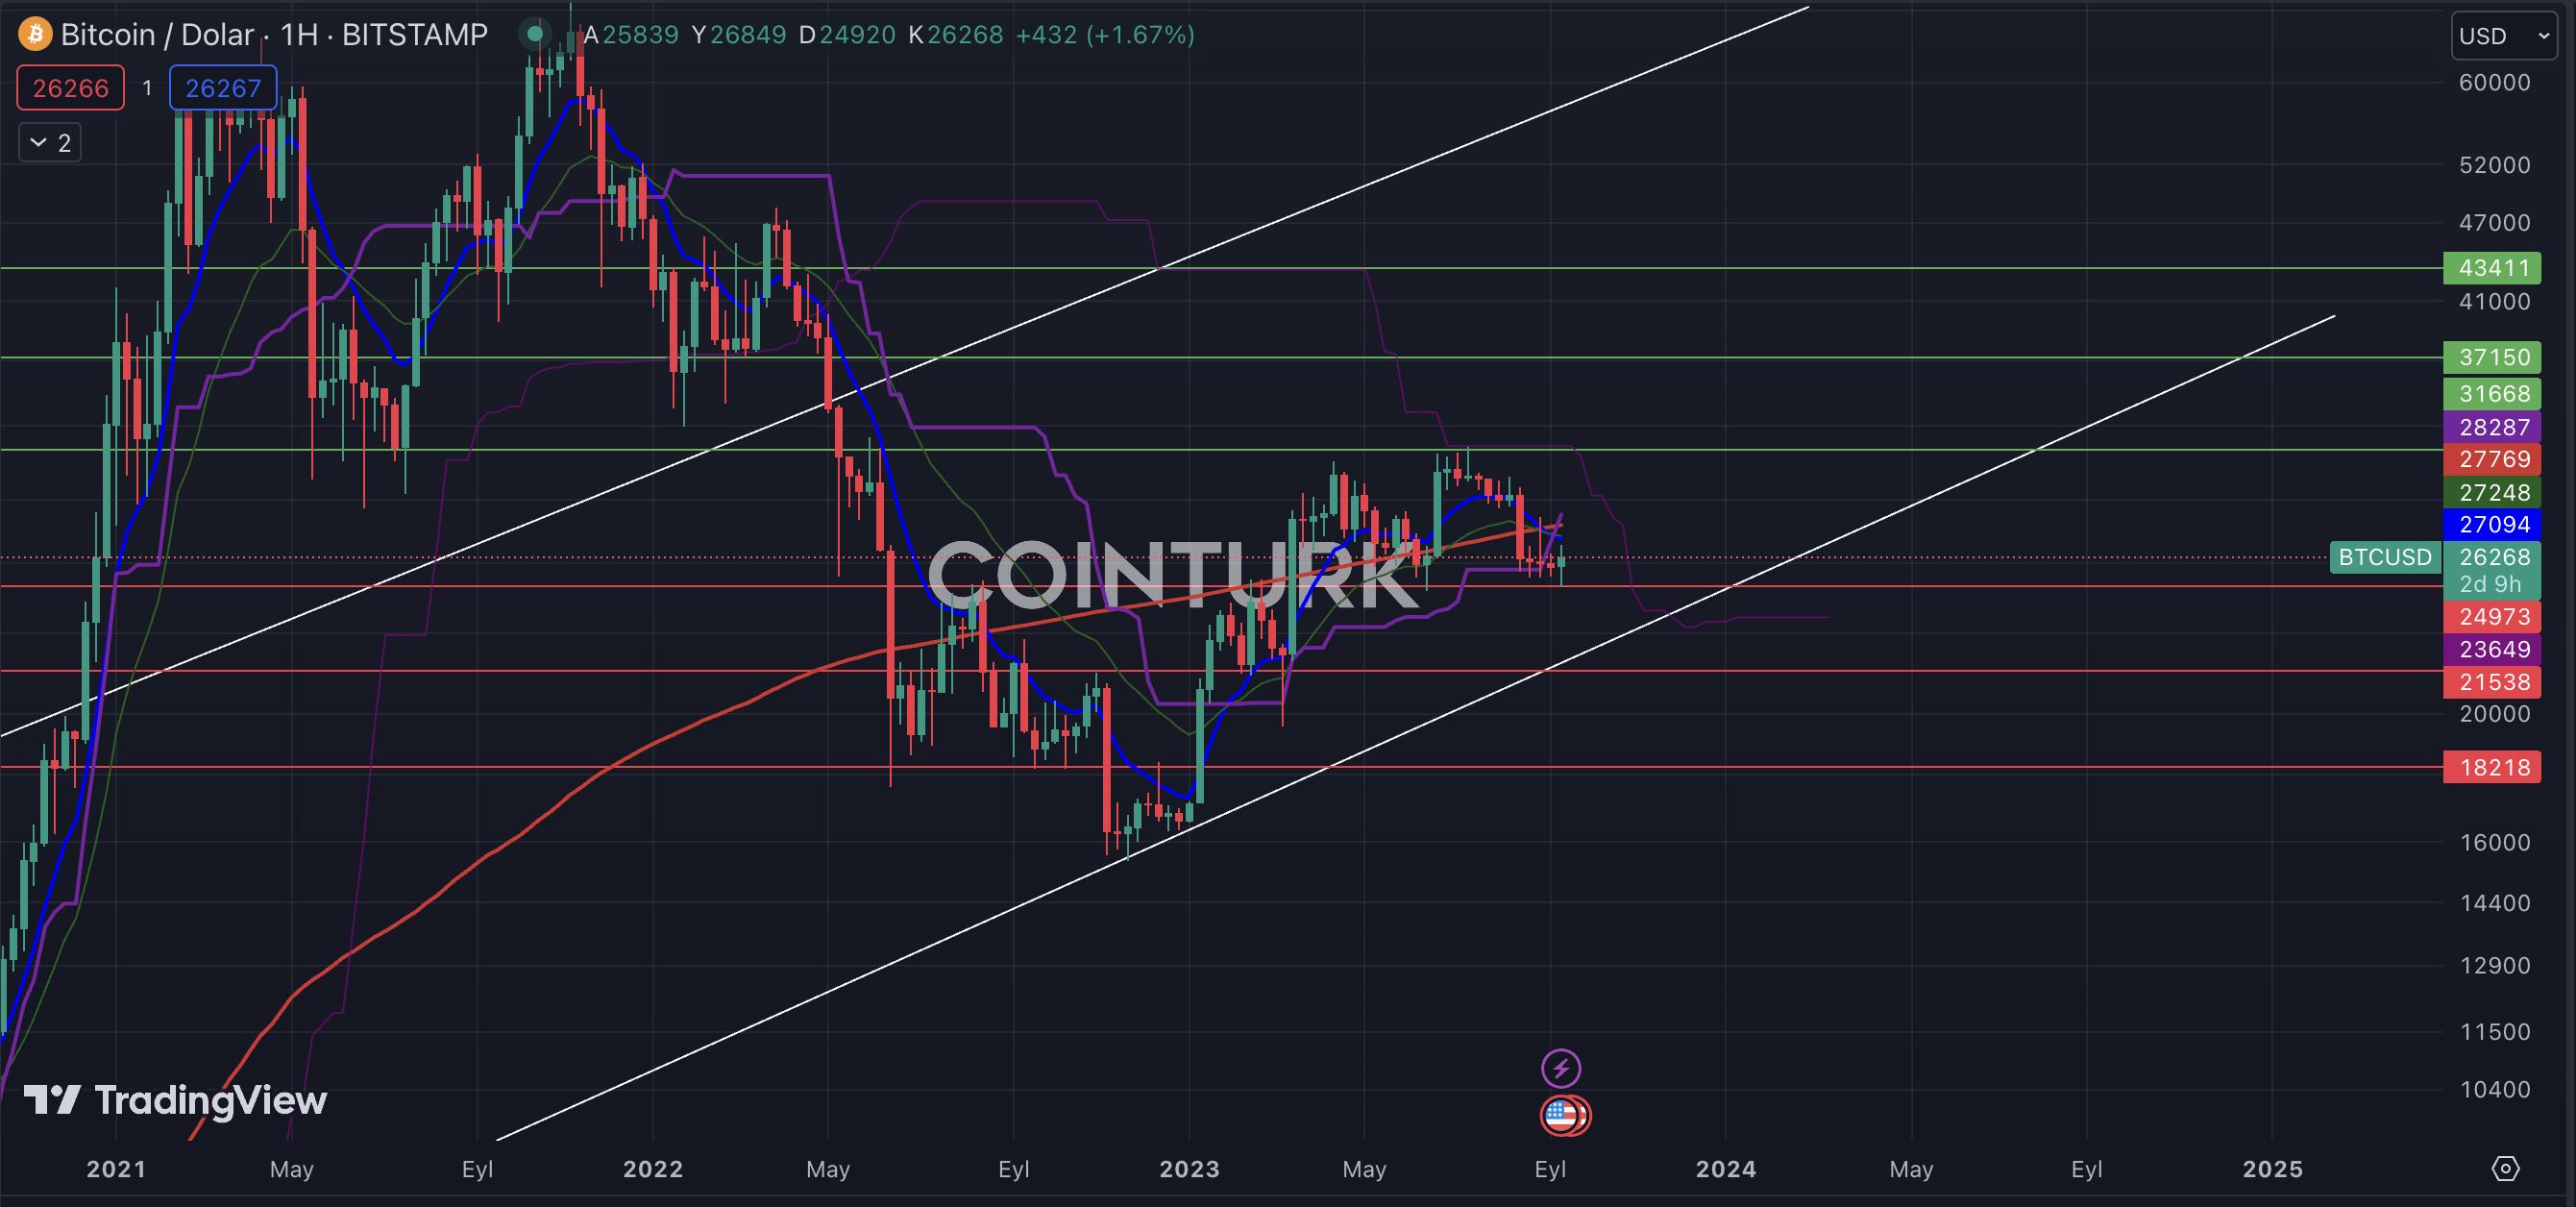
Bitcoin Weekly Chart Analysis
The first notable formation in the weekly chart of Bitcoin is the ascending channel formation starting from the $8,000 level. Especially in this channel formation, the support function of this channel in the downturn in January 2023 will be a positive factor for the long-term price of Bitcoin. Bitcoin staying below the EMA averages creates a negative situation for the Bitcoin price, especially the breaking of the EMA 200 average and several unsuccessful attempts further worsen this situation.
The resistance levels that need to be monitored for Bitcoin in the weekly chart are $24,973, $21,538, and $18,218, respectively. Especially a weekly close below $21,538 can cause a significant decrease in the price of Bitcoin. The support levels that need to be followed are $27,769, $31,668, and $37,150, respectively.