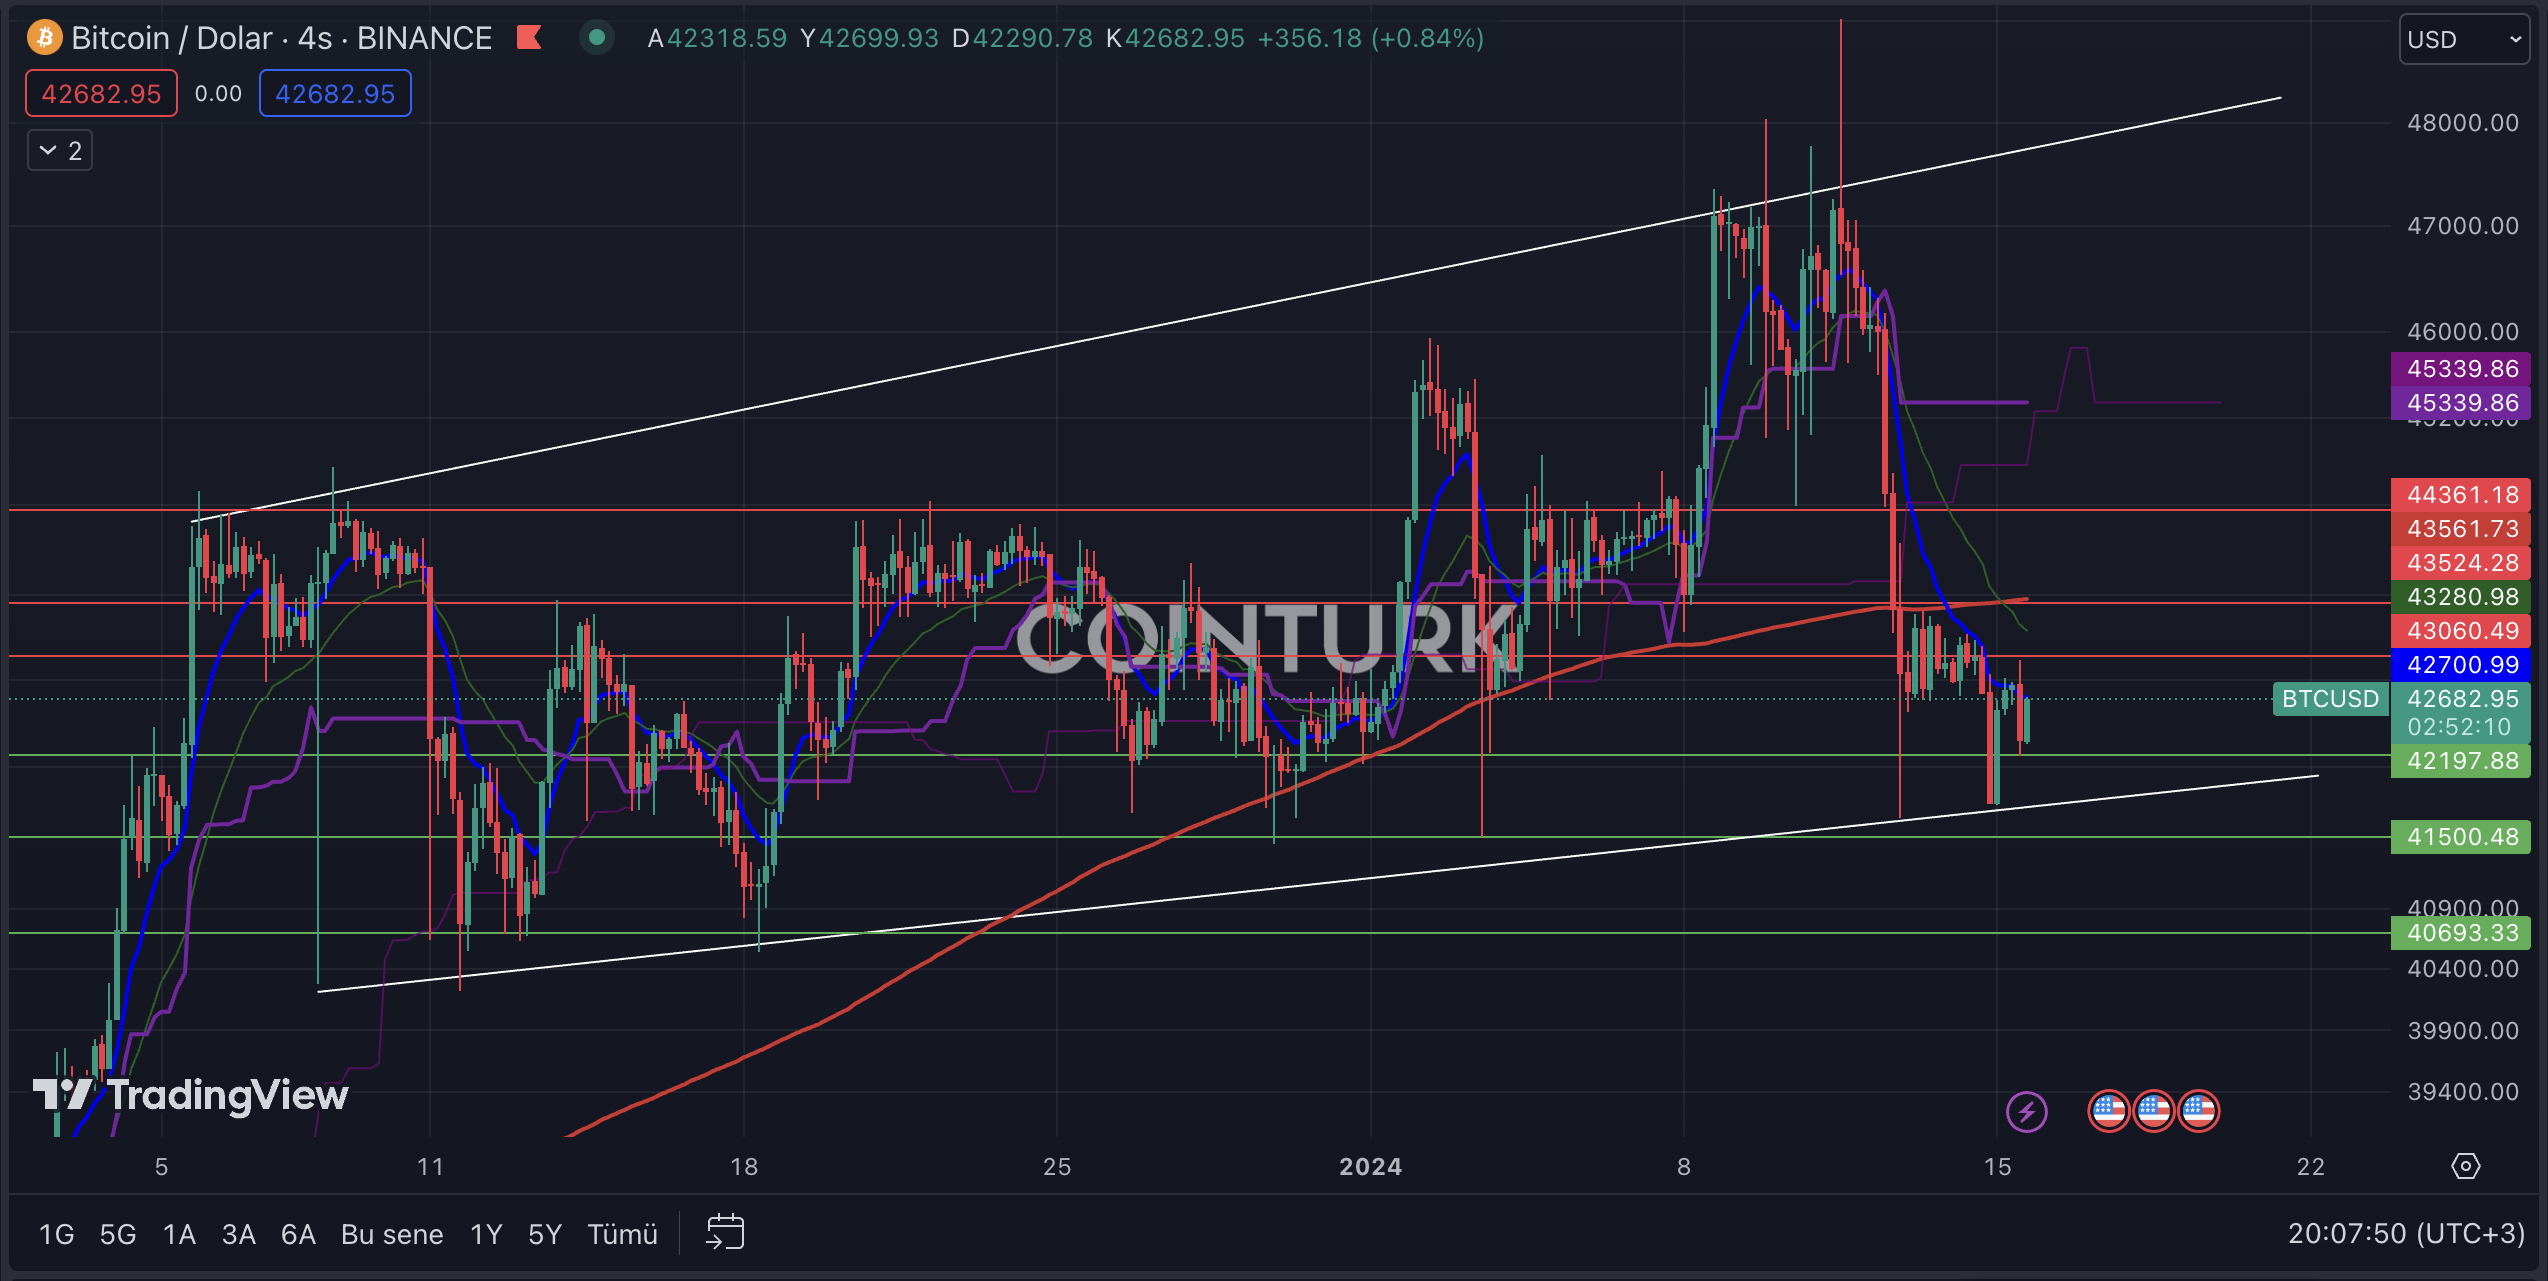
We are witnessing one of the calmest days in the cryptocurrency market recently. Following last week’s volatility, many crypto assets are experiencing a rise on January 15. Bitcoin has started to rise after touching the support line in the four-hour chart. So, what can be expected for Bitcoin, which is trading at $42,703 at the time of writing? Let’s examine together.
Bitcoin Chart Analysis
An ascending channel formation is noticeable in the four-hour Bitcoin chart. After the recent selling pressure and falling below the EMA 200 (red line) level, Bitcoin managed to gain upward momentum after touching the support line. However, the EMA 21 (blue line) could act as a barrier, potentially slowing down the process or causing selling pressure.
The most important support levels to watch in the Bitcoin chart are; $42,197 / $41,500 and $40,693 respectively. Particularly, a four-hour bar closing below the $41,500 level, which intersects with the formation support level, could cause serious selling pressure on the Bitcoin price.
The most important resistance levels to watch in the four-hour Bitcoin chart are; $43,060 / $43,524 and $44,361 respectively. Especially, a four-hour bar closing above the $43,524 level, which intersects with the EMA 200 level, will help Bitcoin’s price gain upward momentum.

Bitcoin Dominance Chart Analysis
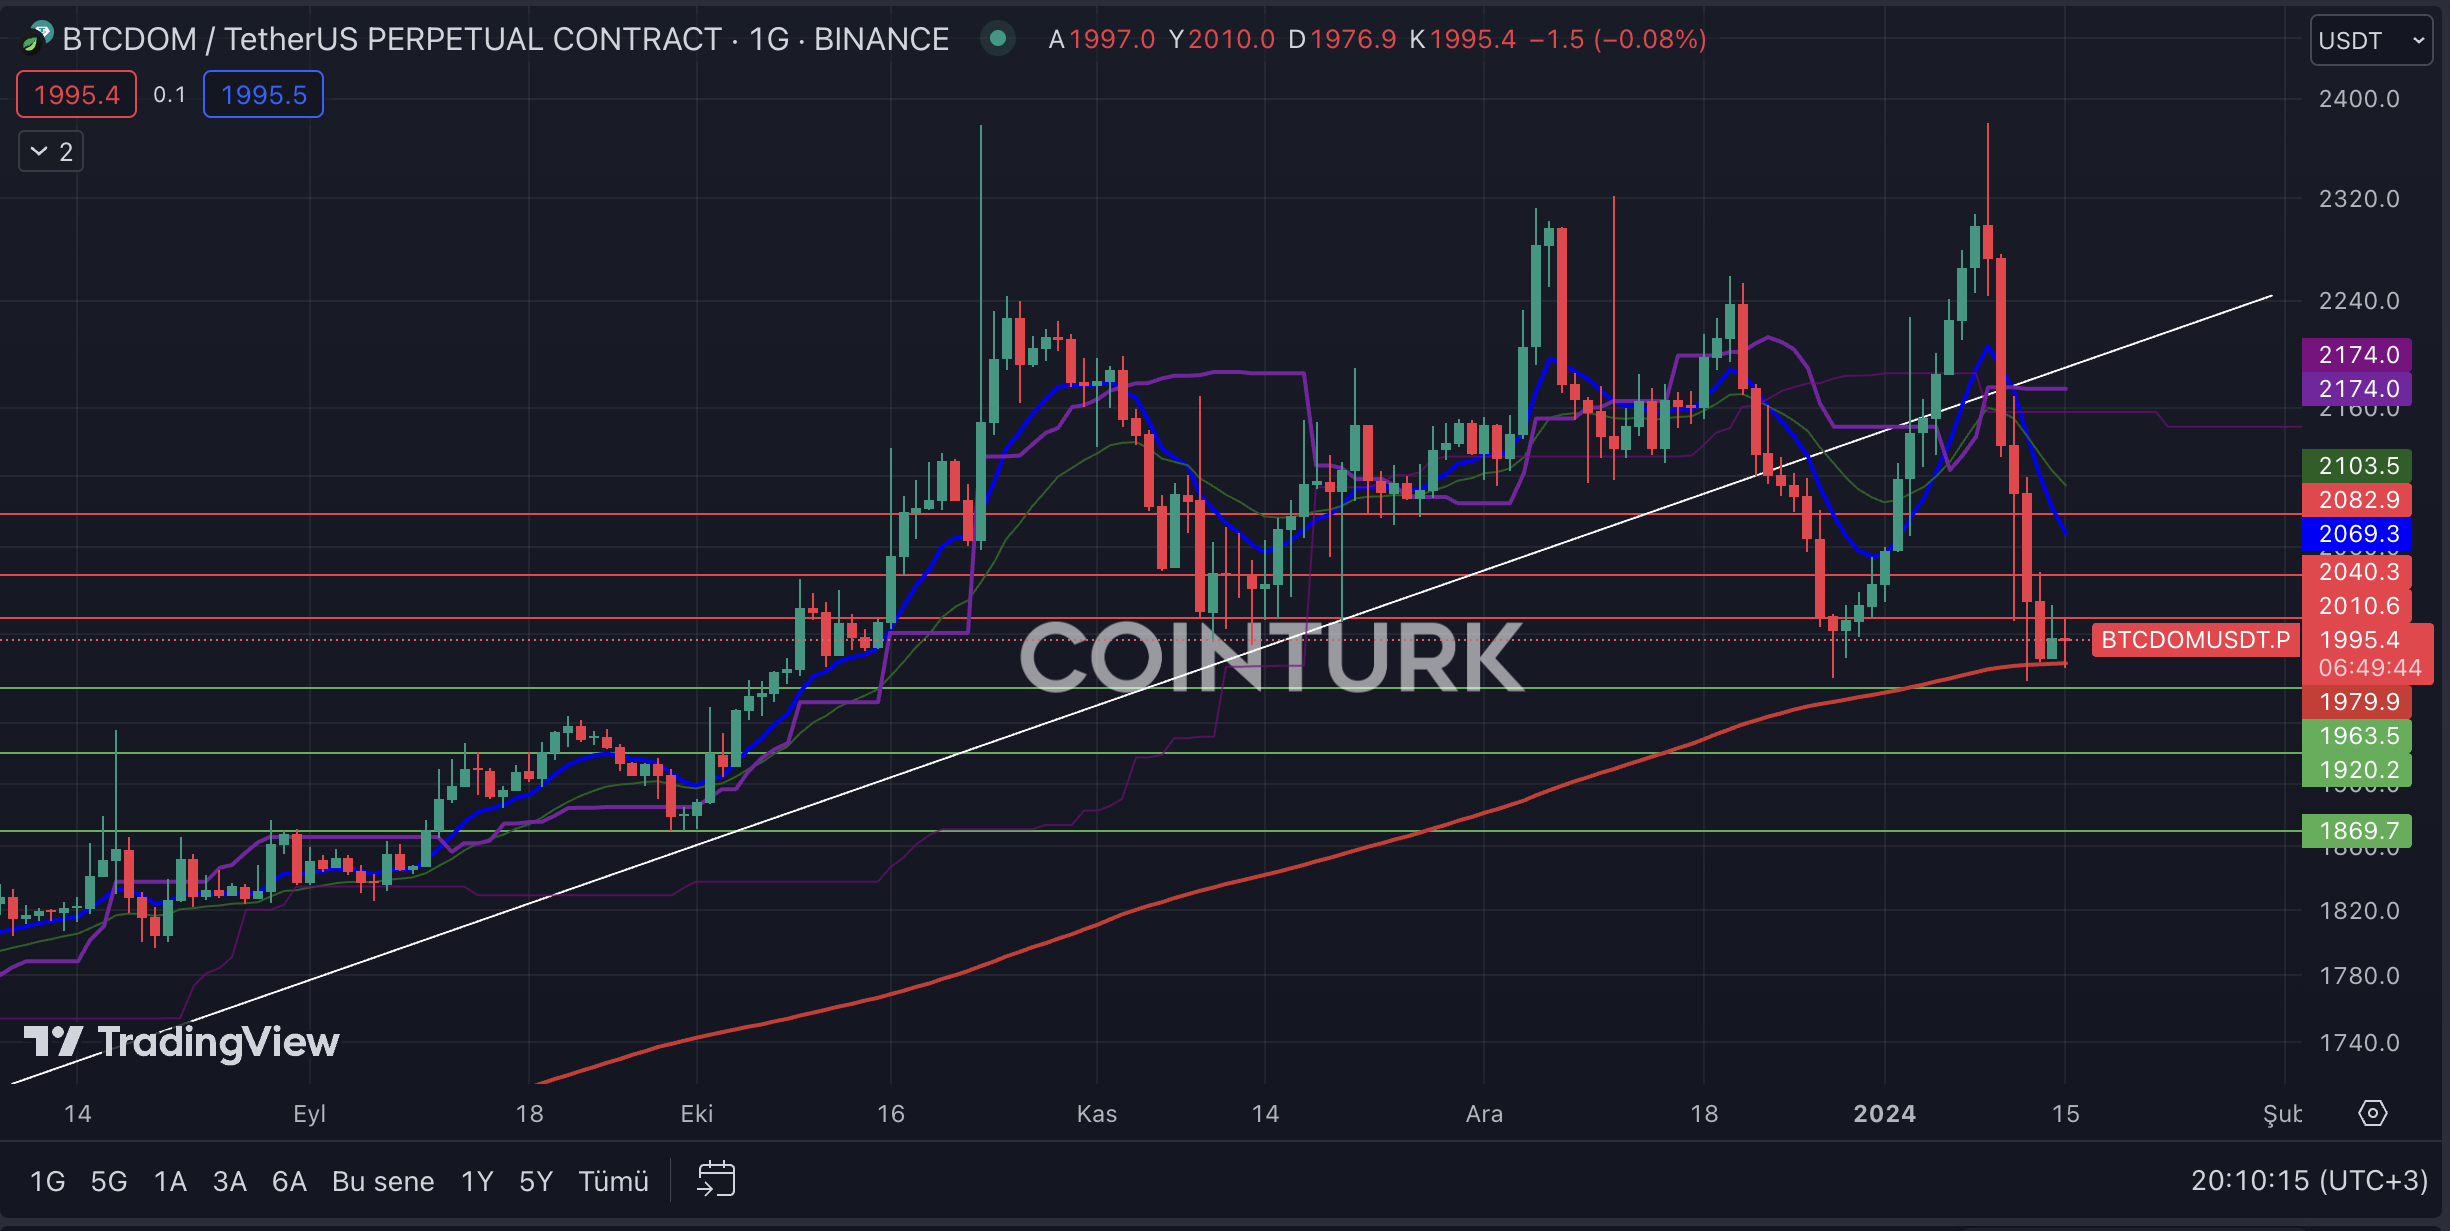
The Bitcoin Dominance ratio, obtained by comparing the cumulative value of the cryptocurrency market and the value of Bitcoin, emerges as an important data point to follow in the crypto market. The volatility of BTCDOM has increased in recent days, and with the last bar closing, the EMA 200 level is acting as a support level, hinting at a potential rise.
The most important support levels to watch for BTCDOM on the daily chart are; 1963.5 / 1920.2 and 1869.7 respectively. Especially, a daily bar closing below the 1963.5 level and breaking the EMA 200 level could lead to Bitcoin losing more value compared to the rest of the crypto market.
The most important resistance levels to watch for BTCDOM on the daily chart are; 2010.6 / 2040.3 and 2082.9 respectively. Particularly, a daily bar closing above the 2010.6 level, which has recently become a significant resistance, will encourage investors to shift from altcoin projects to Bitcoin.


 Türkçe
 Español


