Türkçe
 Español


Developments that excite the cryptocurrency market continue to occur. However, following the process last night, the price of Bitcoin continues to lose momentum. With significant volatility increases in the last 24 hours, all eyes are on the SEC regarding Bitcoin’s future. What clues does the Bitcoin chart give us for the upcoming period? Let’s examine together.
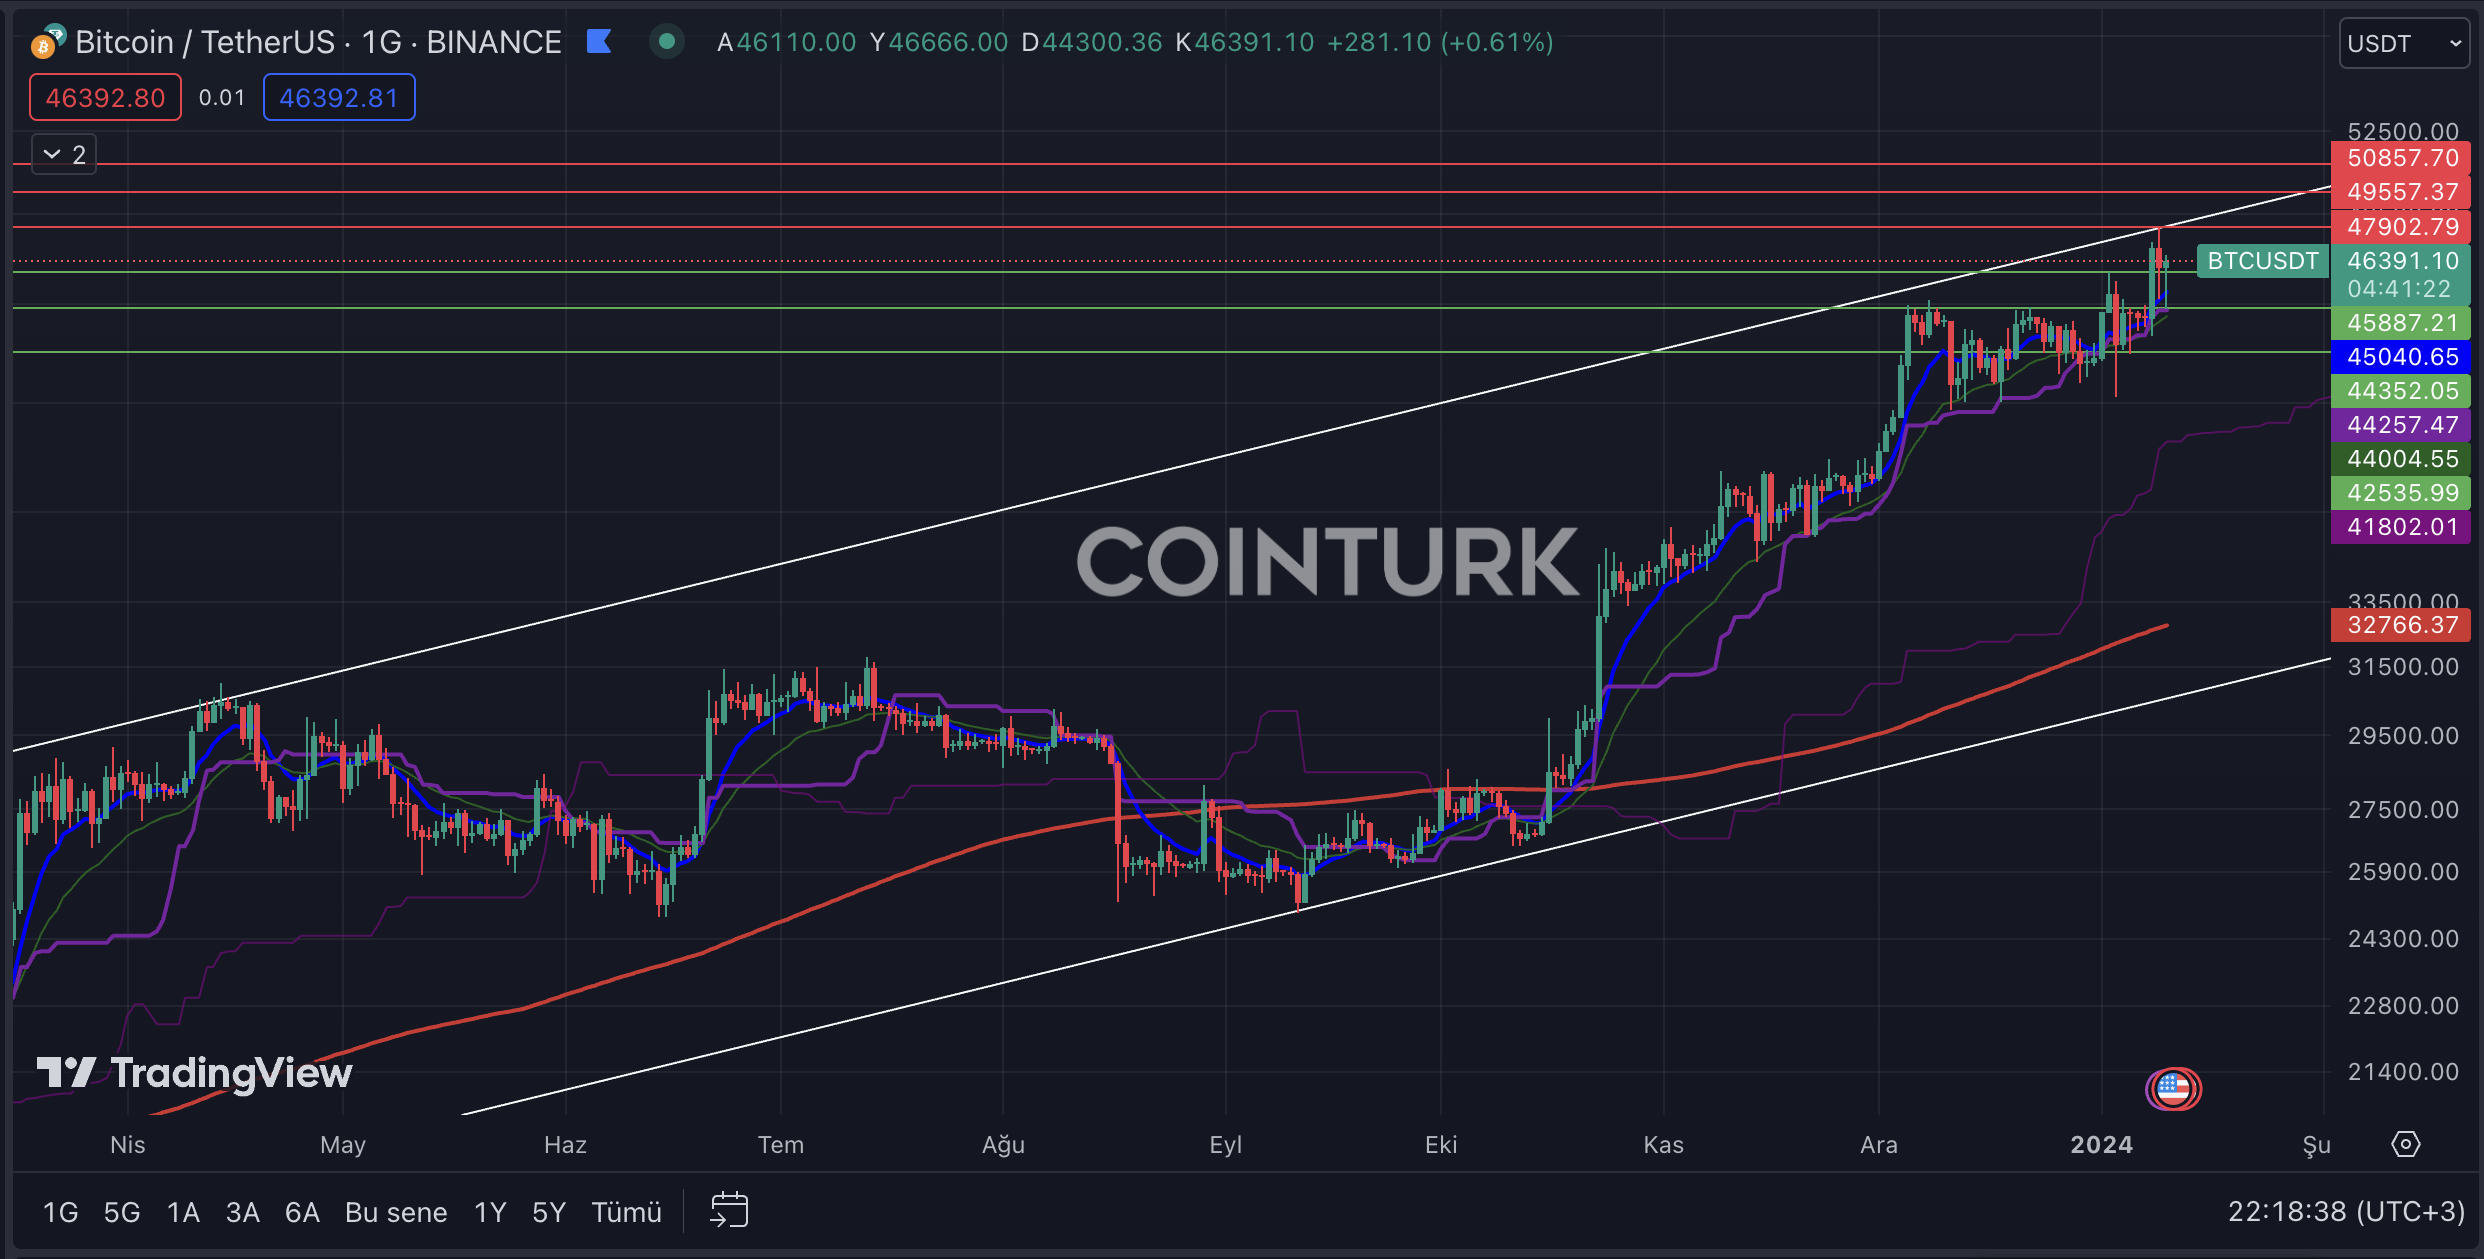
Bitcoin Chart Analysis
The first notable formation structure in the daily Bitcoin chart is the ascending channel formation. In this formation structure, the rejection of the bar formation from the resistance line on January 9th could mark the beginning of an important period for Bitcoin in the medium term. Particularly, a negative outcome in the process of spot Bitcoin ETF applications could create selling pressure on Bitcoin.
The most important support levels to follow in the daily Bitcoin chart are, respectively; $45,887 / $44,352 and $42,535. Especially, a daily bar closing below the significant level of $44,352, which played an important role in the last bar formations, could lead to selling pressure on Bitcoin’s price.
The most important resistance levels to watch in the Bitcoin chart are, respectively; $47,902 / $49,557 and $50,857. Particularly, a four-hour bar closing above the resistance line intersecting formation structure at $47,902 could significantly accelerate Bitcoin’s price and lead it to reach the highest levels of the last two years.
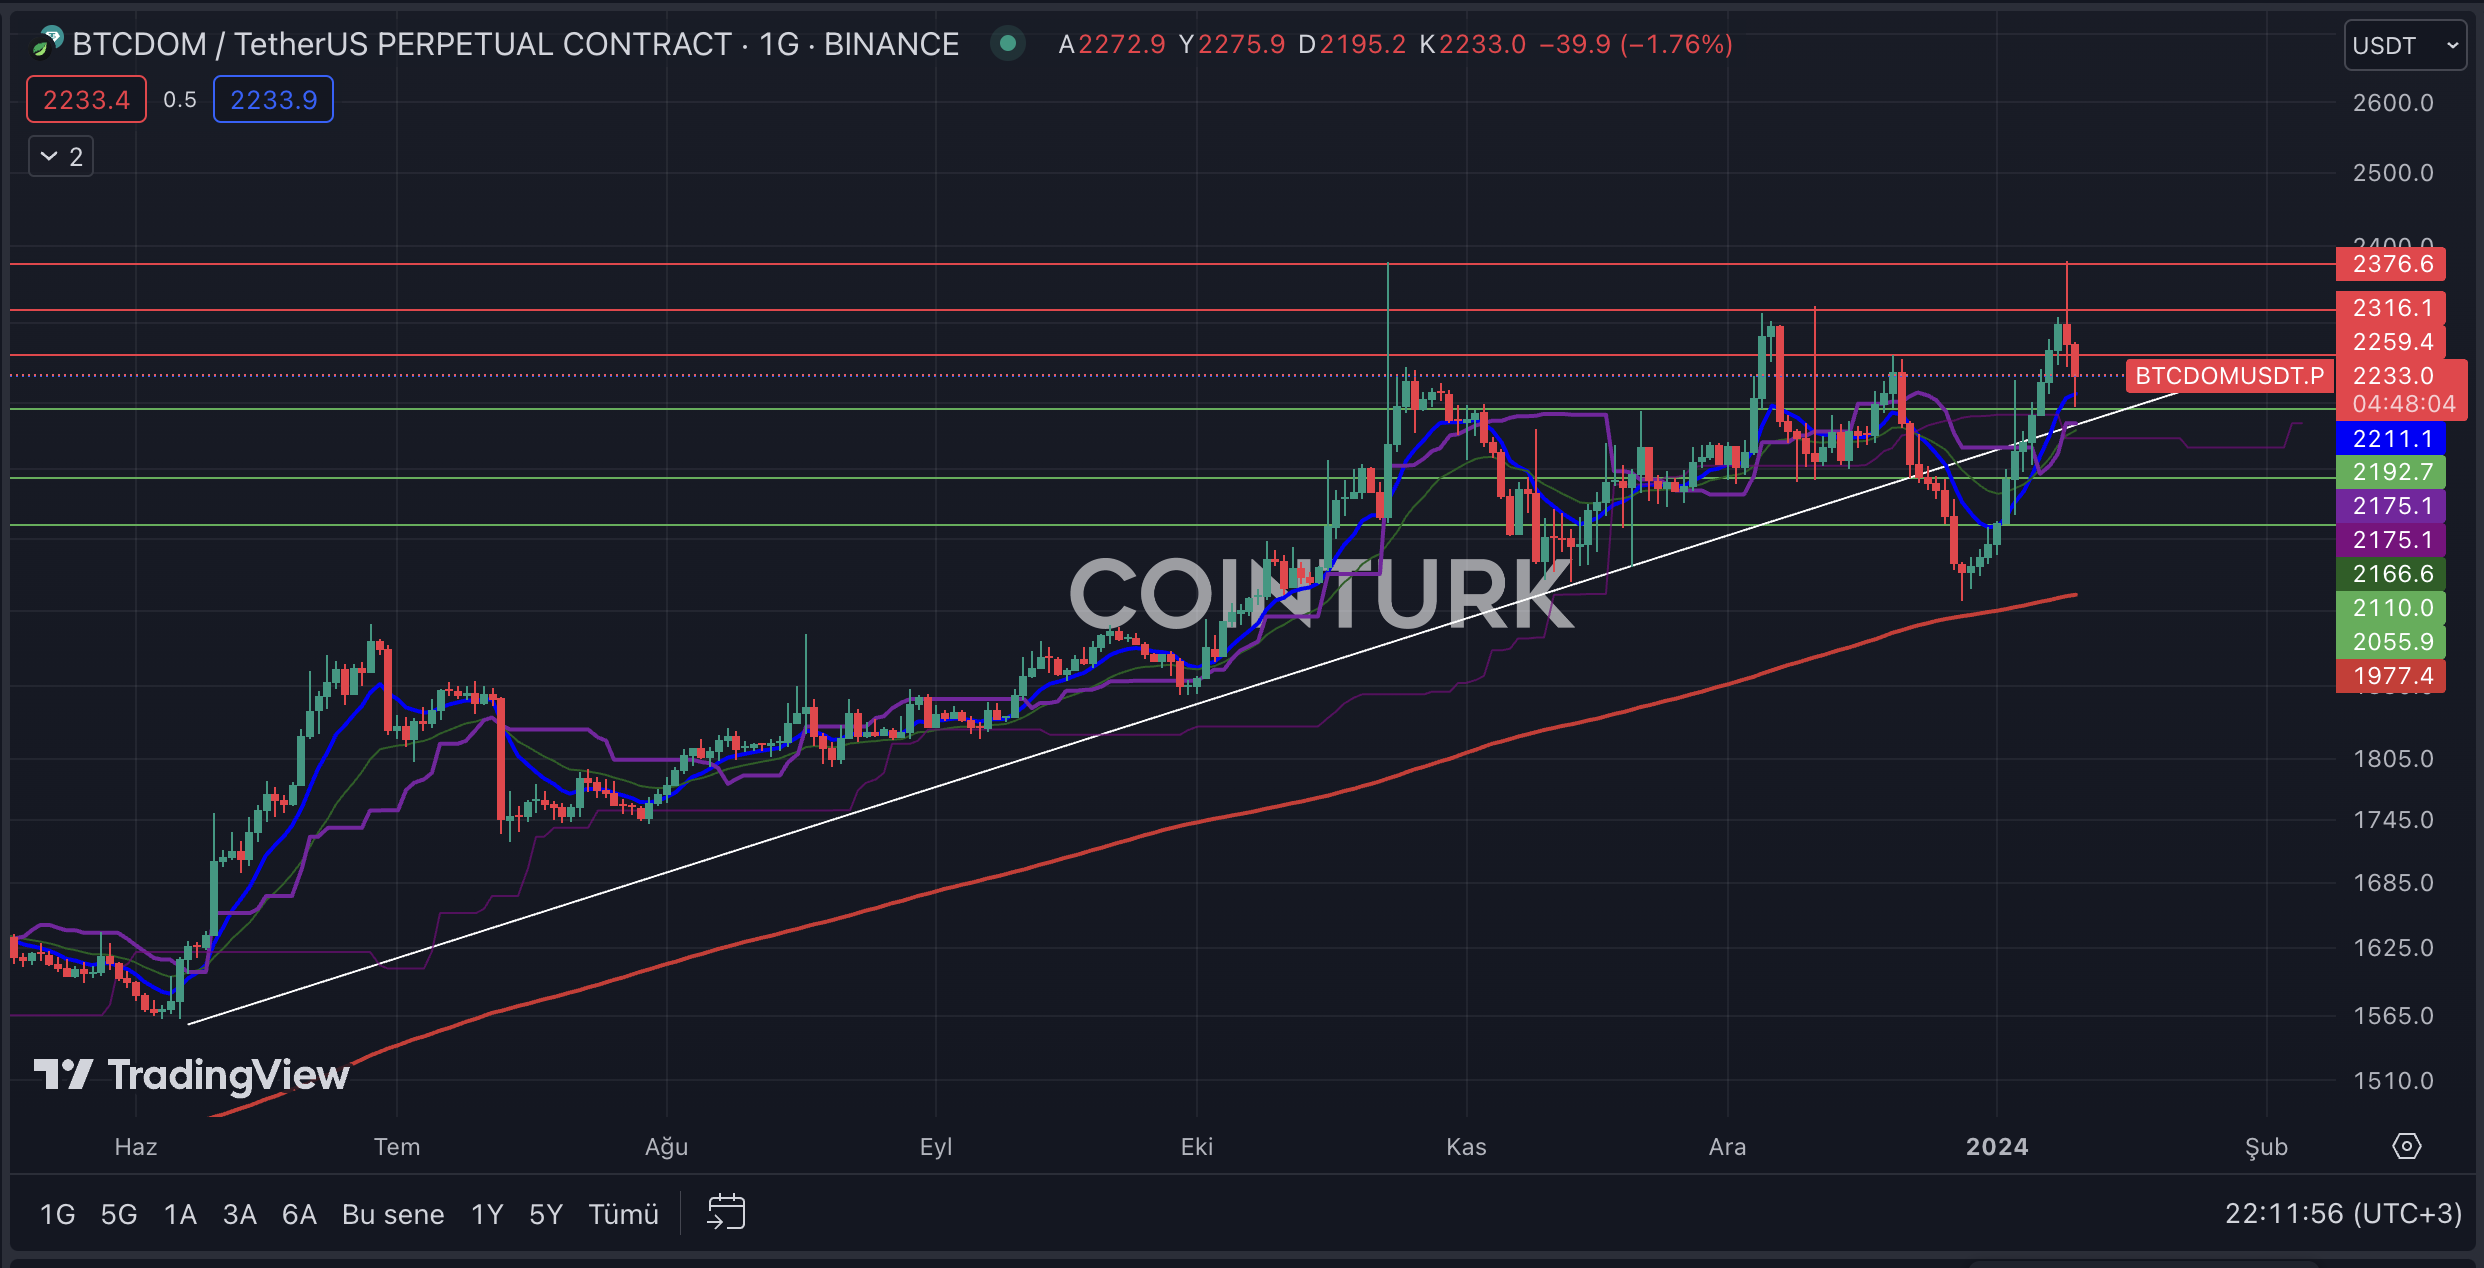
Bitcoin Dominance Chart Analysis
In the daily BTC.D chart, the decline at the end of December was reversed above the support trend line with the help of the EMA 200 level. The biggest development in this regard stems from the eager anticipation related to the spot Bitcoin ETF process in the markets. Many investors preferred to invest in Bitcoin over altcoin projects.
For BTC.D, the most important support levels to watch in the daily chart are, respectively; 2192.7 / 2110.0 and 2055.9. Particularly, a daily bar closing below the 2192.7 level, which intersects with the trend line, will lead to a decrease in Bitcoin’s dominance in the crypto market.
For BTC.D, the most important resistance levels to follow in the daily chart are, respectively; 2259.4 / 2316.1 and 2376.6. Especially, a daily bar closing above the 2376.6 level, which played a significant role in the recent upward momentum, will encourage investors to shift from altcoin projects to Bitcoin.