Bitcoin has been stuck between $24,936 and $26,460 for almost a month now, which has become boring for both short-term leverage traders and long-term investors. Particularly, the pressure created by Bitcoin’s price on the altcoin side has caused the market to constantly lose value and led to significant losses in many tokens. In this article, we will examine the charts of popular tokens among investors: Chiliz, Ceek, and Luna.
Chiliz Chart Analysis
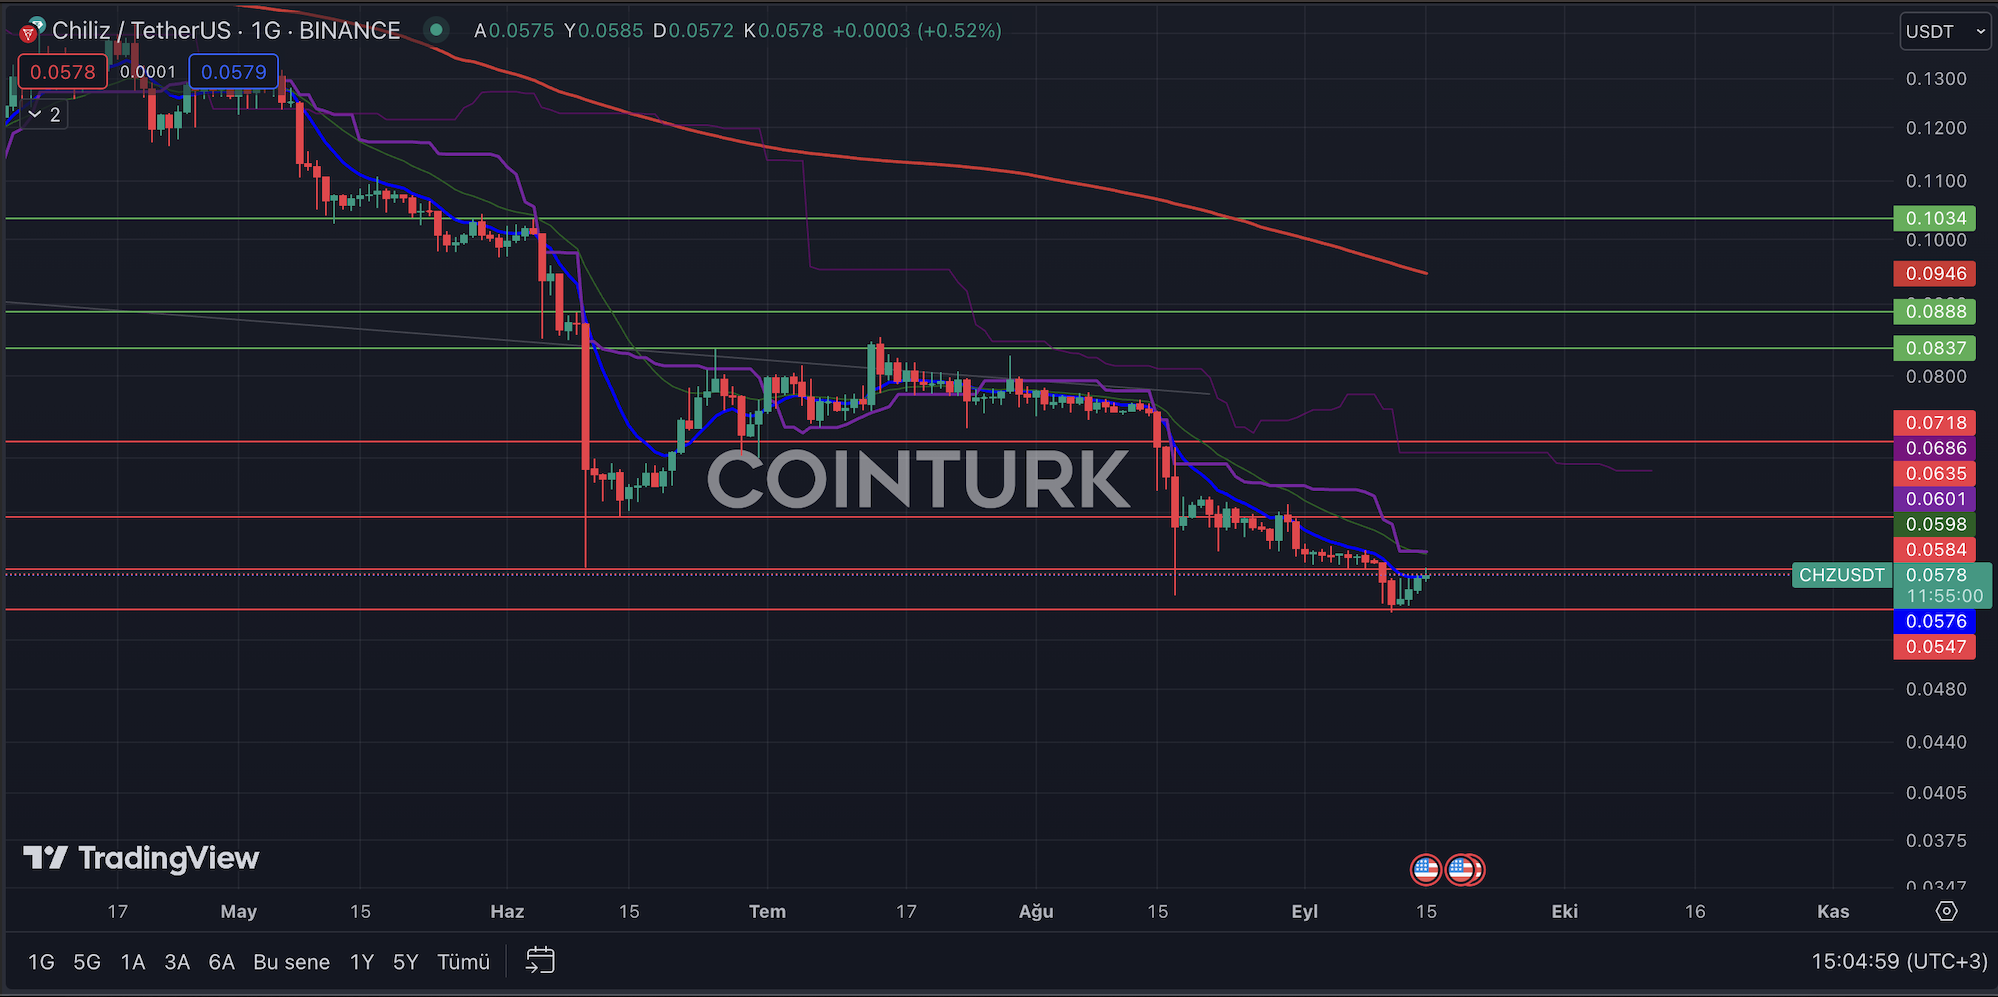
At the beginning of May, the Layer-2 network project announced by the Chiliz team managed to attract the attention of many investors, and the price of Chiliz reflected this news positively. However, in the following period, the Chiliz price failed to meet expectations, and there has been significant selling pressure, especially in the past month.
While there is no formation to mention on the daily chart, the Chiliz price continues to stay below important EMA levels. The most important support level to watch for Chiliz, which has seen the lowest levels in years, is $0.0547. There will be significant selling pressure below this level, and the resistance levels to be followed are $0.0584, $0.0635, and $0.0718.

Ceek Chart Analysis
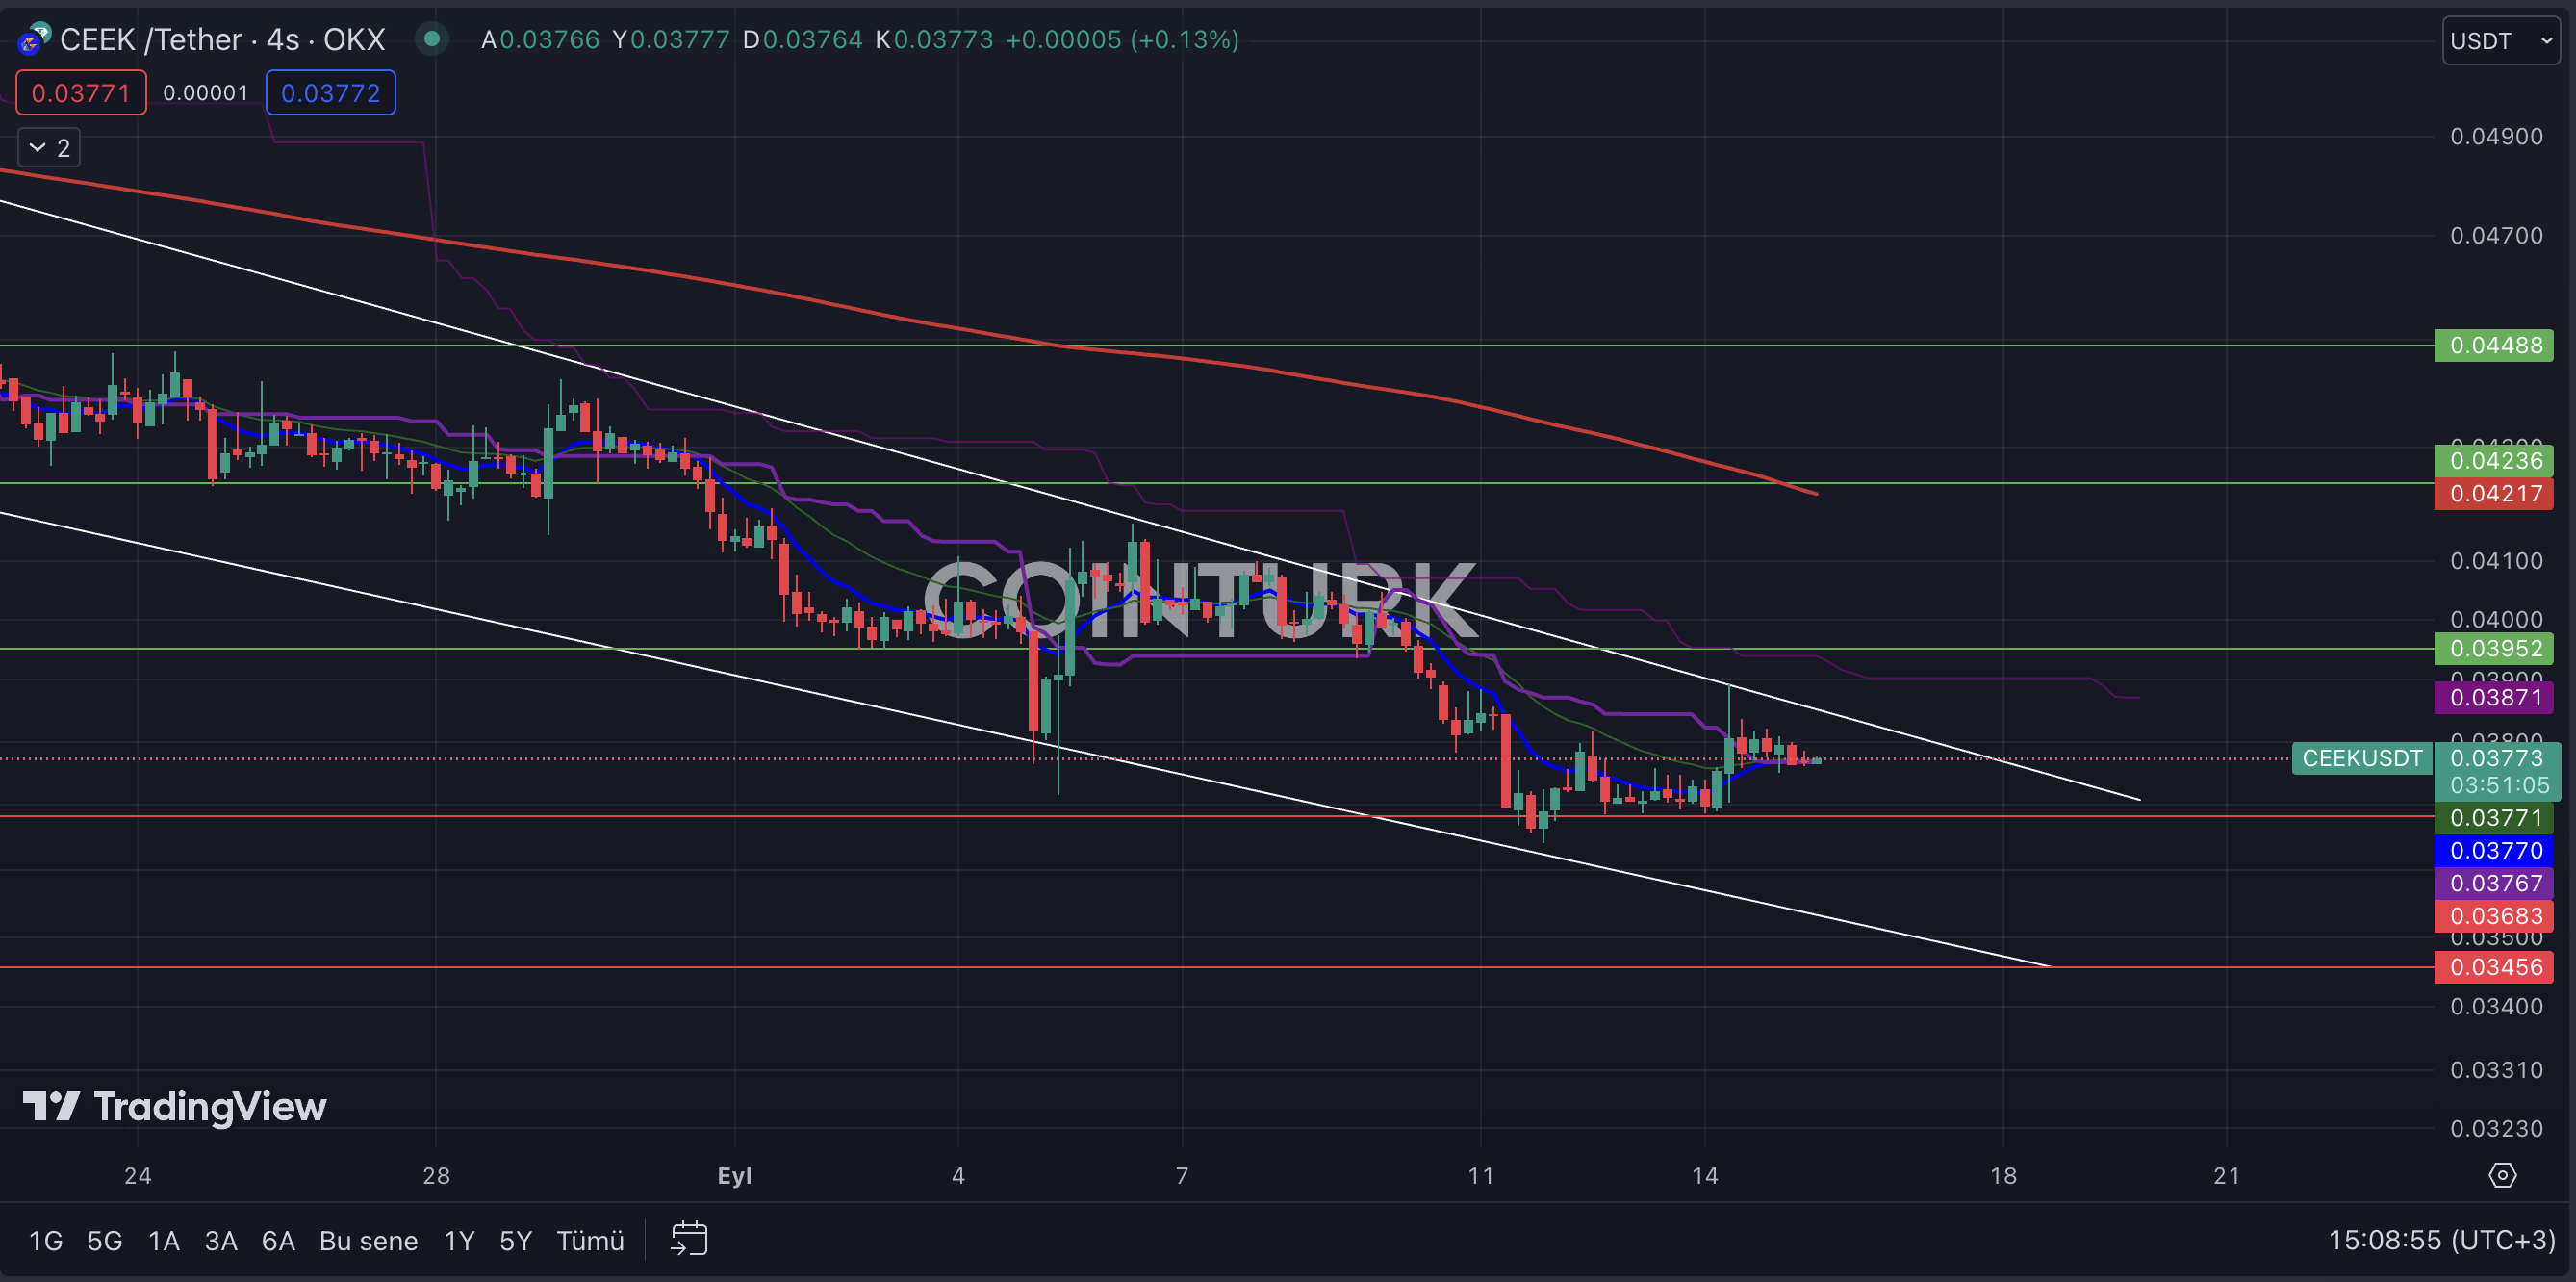
On the 4-hour chart, the first noticeable formation for Ceek is a descending channel formation. This formation has been negatively affecting the price of Ceek for almost a month, and the resistance level needs to be broken for a significant price increase.
The most important support levels to be monitored for Ceek are $0.03770, $0.03683, and $0.03456, respectively. Especially, if a 4-hour closing occurs below the $0.03683 level, it can trigger a formation breakout and increase selling pressure. The important resistance levels are $0.03871, $0.03952, and $0.04100.

Luna Chart Analysis
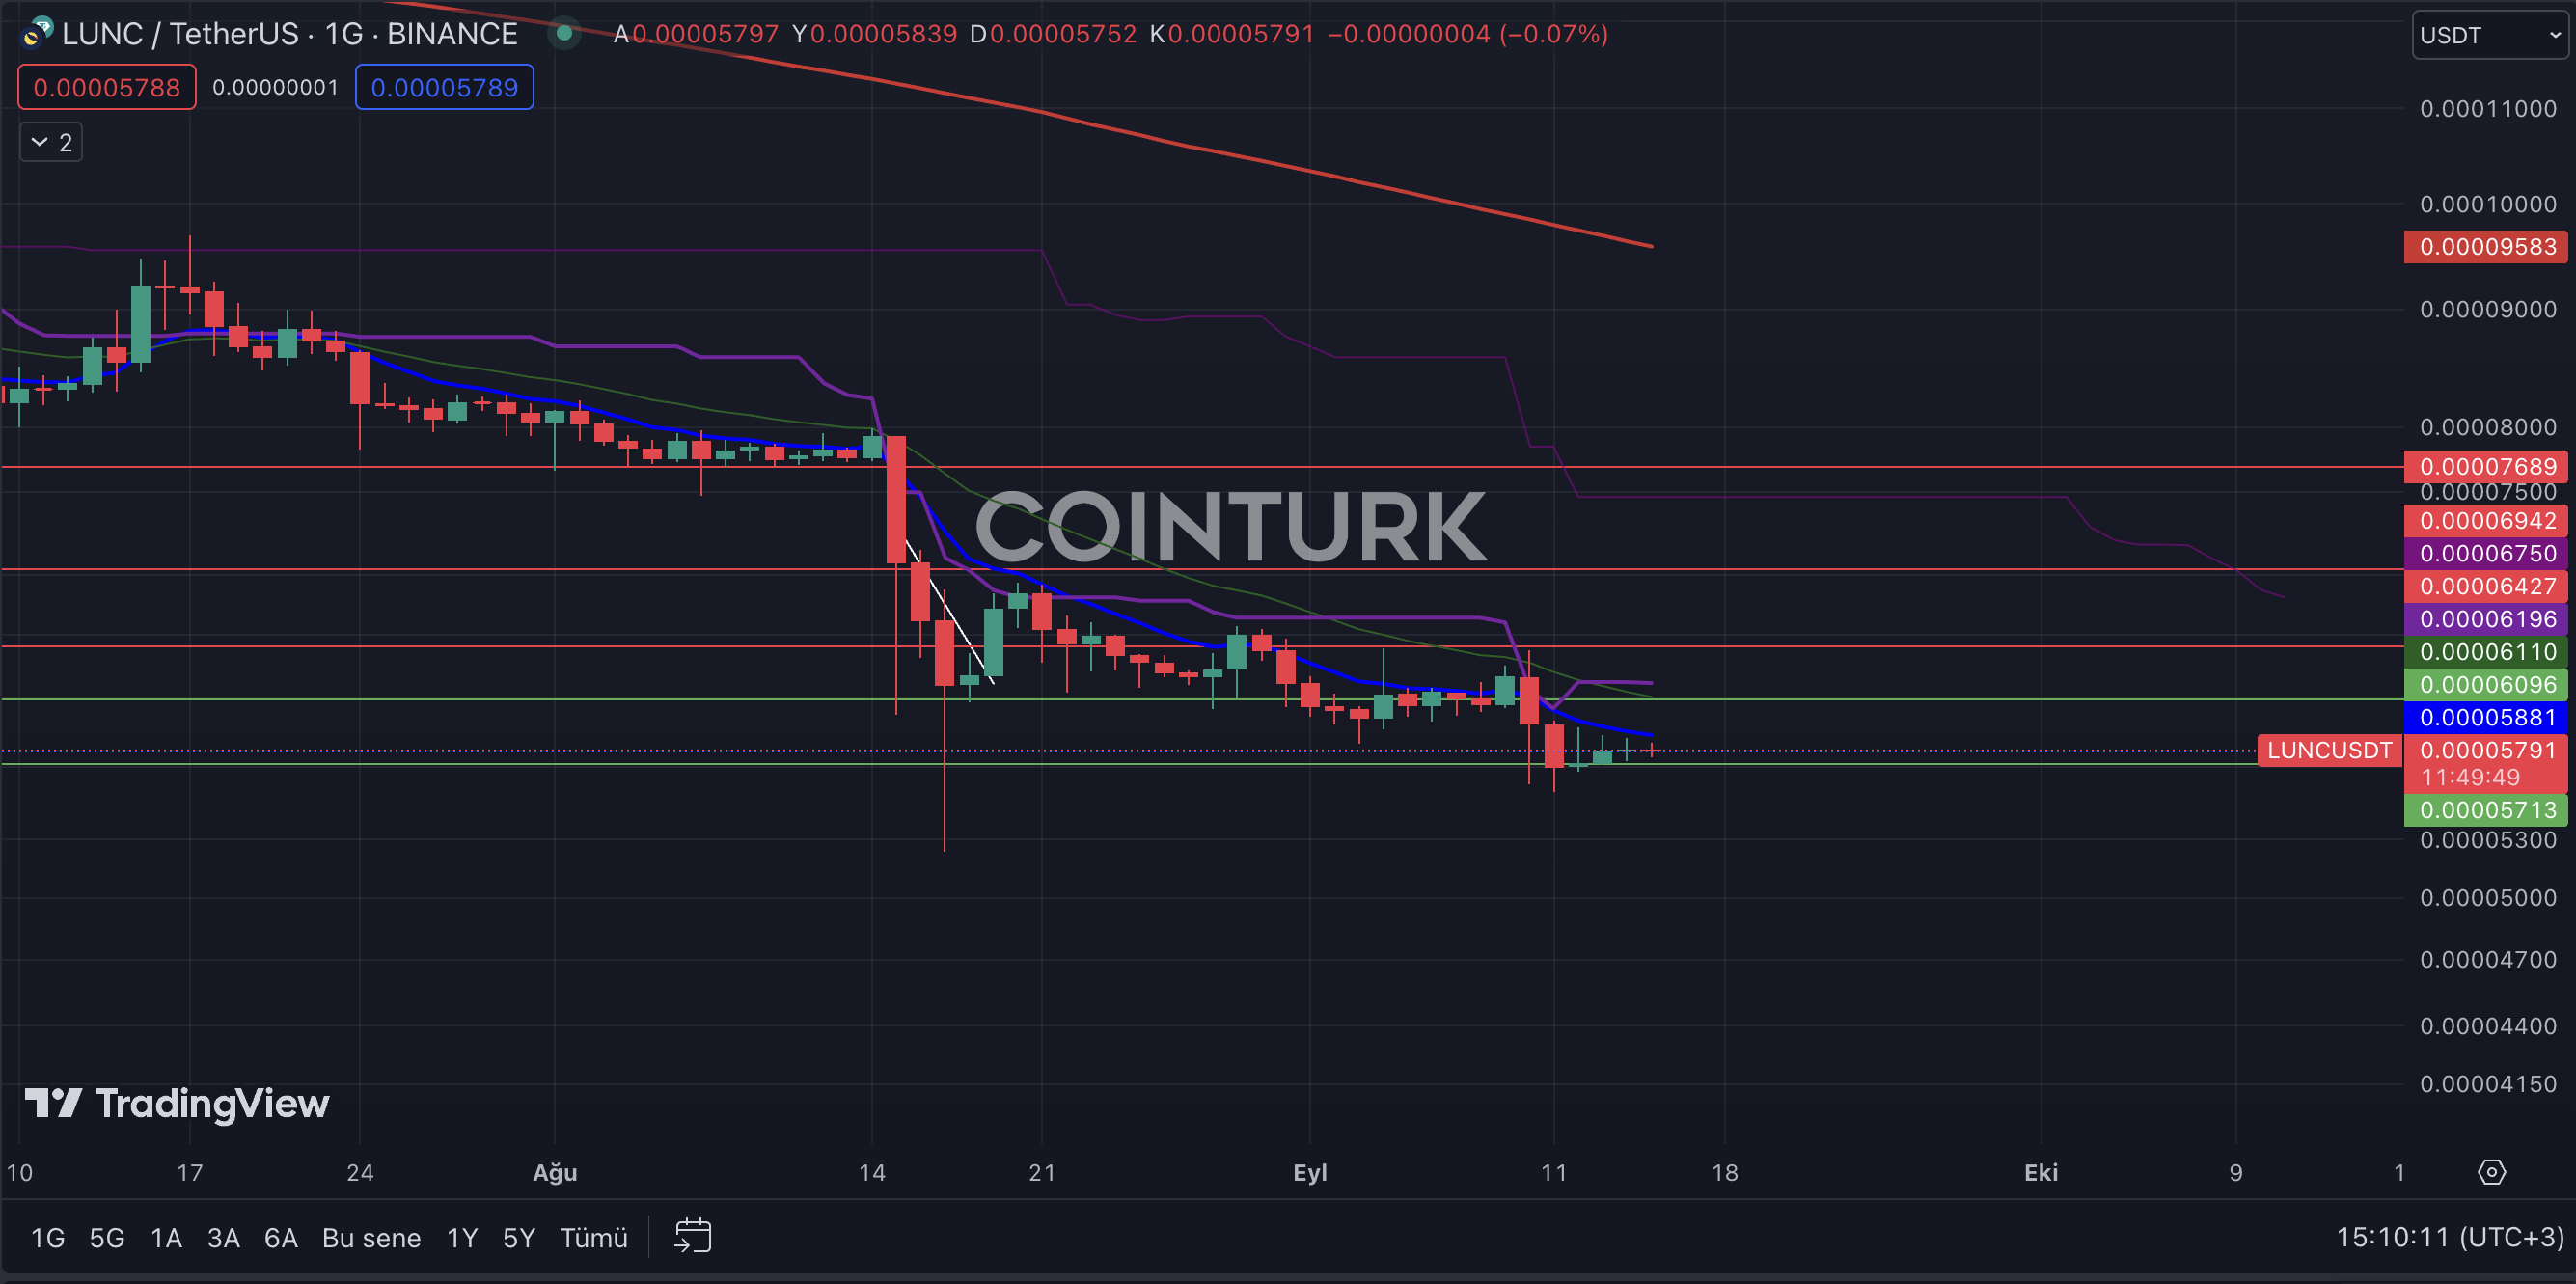
On the daily chart of Luna, we can see the lowest price levels in recent periods, just like many altcoins, and support is being sought. In Luna’s chart, where we cannot mention any formation, the price below the EMA averages has been hovering in the same area for almost a month.
The most important support level to be monitored for Luna is $0.00005713. The fact that this level has worked 5 times on the daily chart shows that it is crucial for Luna. The resistance levels to be watched for Luna are $0.00006096, $0.00006427, and $0.00006942, respectively.


