Ordinals (ORDI) have hosted an extraordinary rise in recent months. In September, it was trading at $2.82, while in the first week of December, it suddenly surged to $69.76.
During this period, a gain of 2370% was observed by measuring the region between the lowest level in September and the highest level achieved in the first week of December. In the past ten days, however, there was a retracement in price to retest the $44 level, which is seen as a support level. This also resulted in the formation of a price range.
Ordinals (ORDI) and Support Levels
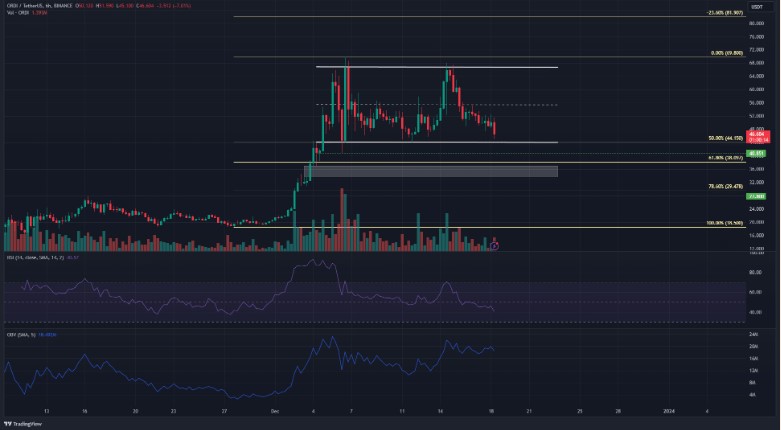
This range (white) defines the area between $44.15 and $66.9, where ORDI faced strong resistance once again on December 14. Additionally, the intermediate level region at $55.52 asserted its presence as a clear resistance zone during the period of price movements.
The $55.52 level was tested multiple times and has fully transformed into resistance after the pullbacks in the last few days. The RSI also accompanied the current downward momentum and fell below the neutral level of 50. Meanwhile, the OBV continued its fluctuating movement without giving much of a clue since December 14.

Considering this movement of OBV, it wouldn’t be wrong to say that the selling pressure is relatively weak. During this time, traders could be watching for a buying opportunity. A retest of the $44 level, calculated as the potential lowest level, could give traders what they are looking for.
The $44 level is also located in the same region as the 50% Fibonacci retracement level. The $38 and $29.5 levels could also serve as support if ORDI prices were to fall further.
Ordinals (ORDI) Bears Appear Weak
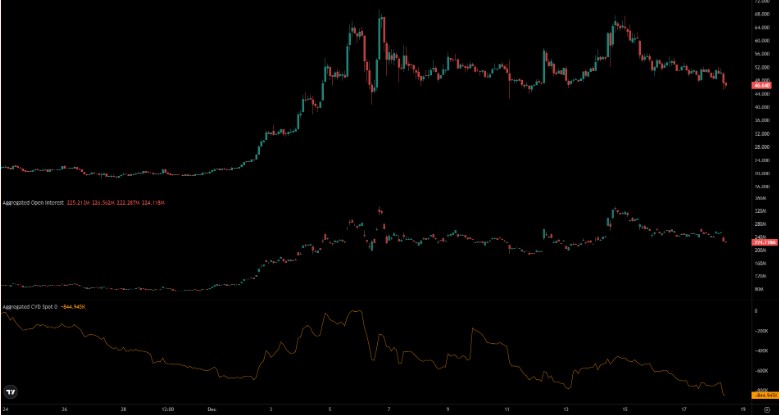
During the continuation of the uptrend that drove the price to its peak at the beginning of December, Open Interest (OI) also rose steadily and noticeably. Before the general market-related price drop in ORDI, this value had reached $320 million on December 6. A similar appearance was reflected in the OI chart over the past week. These charts were reflecting the short-term downward trend of the last few days to investors.
Not only OI but also the spot CVD had been showing a downward trend since December 14. This indicated that selling pressure was dominant in the spot markets. All these emerging situations helped explain the decline in price.
If ORDI prices potentially reach $44 and then show a reversal movement bouncing from there, it could be the biggest sign that buyers have regained control.


 Türkçe
 Español


