Developments in the Ripple front continue to have an impact on the cryptocurrency market. Many altcoins, led by Bitcoin, have risen from significant support levels. This week, the focus is on where the Bitcoin price will close for the week. If weekends pass with low trading volume in the cryptocurrency market, it can trigger a decline and the gains made in this rise can evaporate. In this article, we will examine the charts of Avax, Solana, and Chiliz.
Avax Chart Analysis
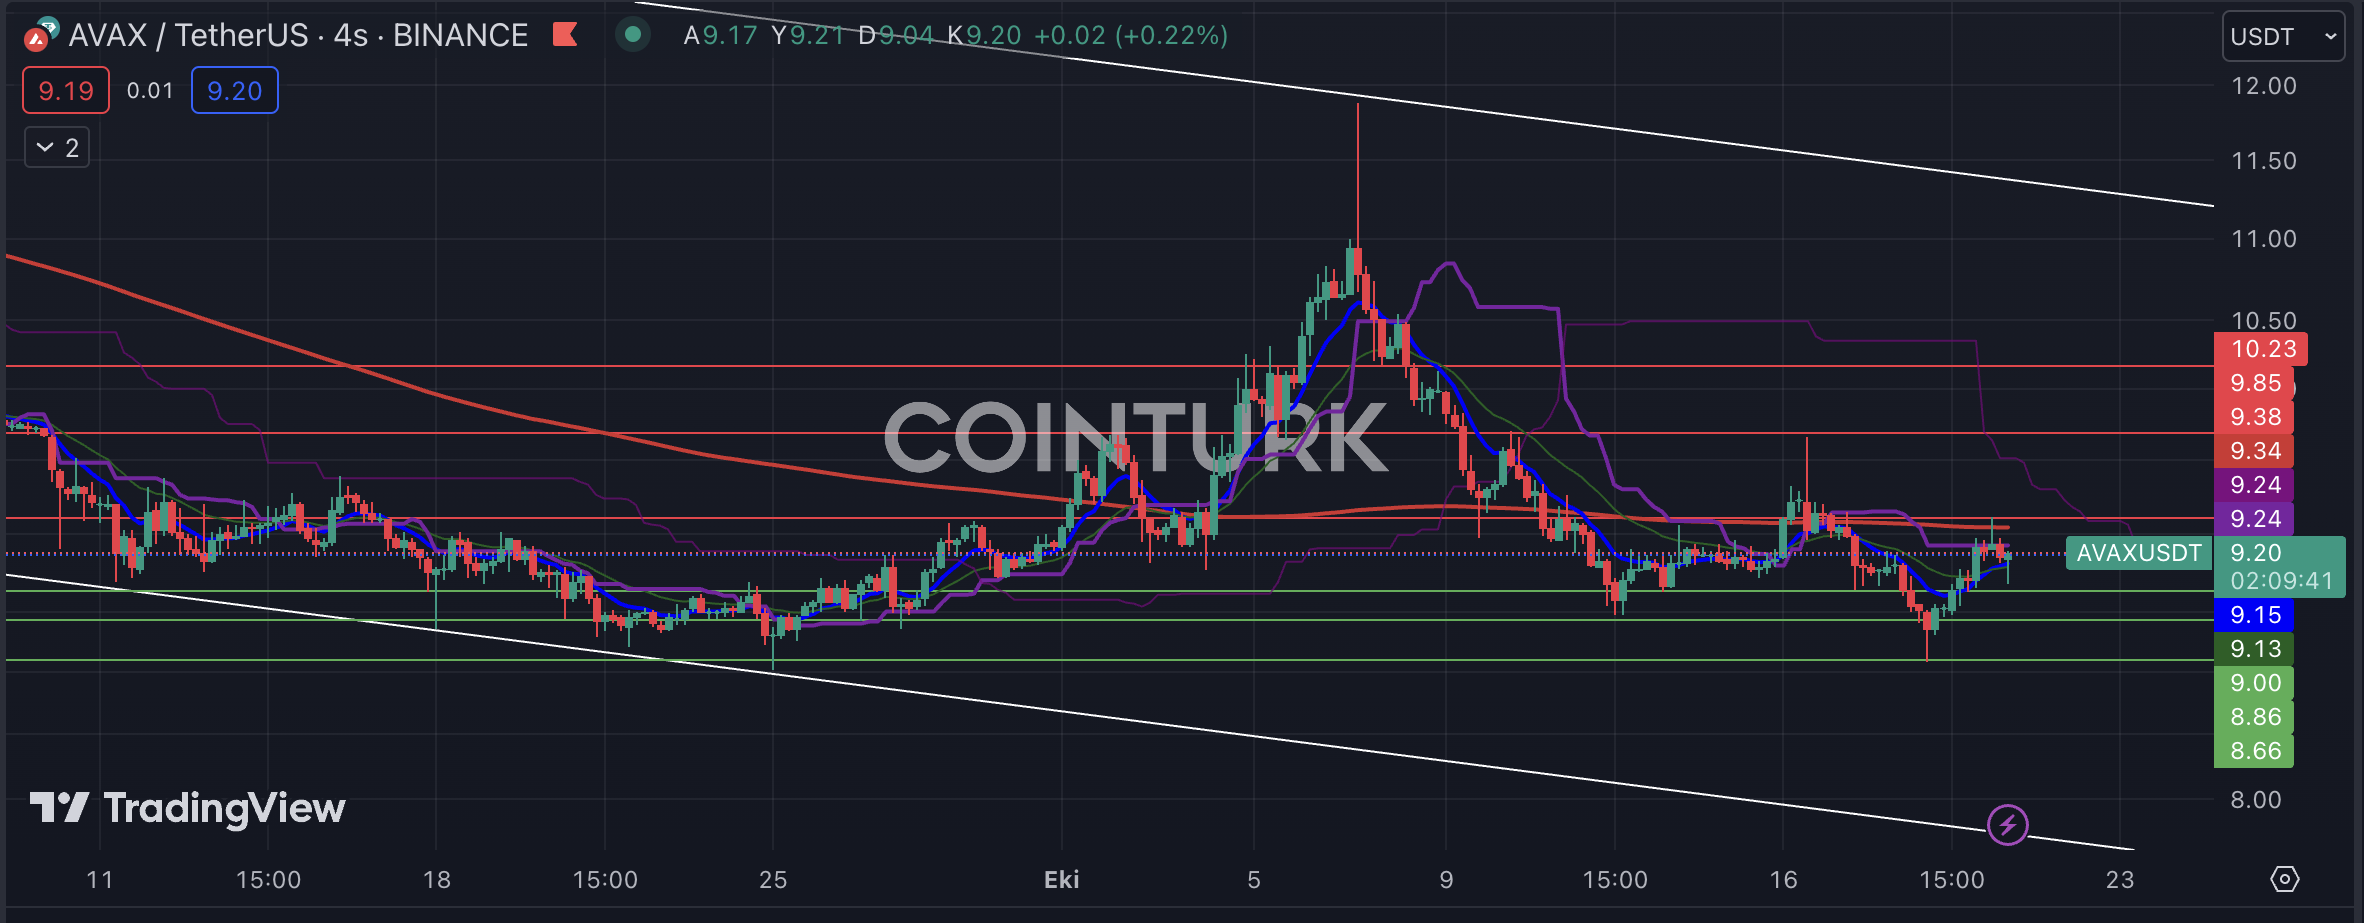
The descending channel formation is the first noticeable structure in the four-hour Avax chart. Avax, which continues its movement within this structure, touched the resistance line together with the SocialFi hype that occurred on October 5th and experienced a significant decline from there. Avax also faces resistance at the four-hour EMA 200 level, which suppresses the price.
The notable support levels in the four-hour Avax chart are 9.00 / 8.86 and 8.66 dollars, respectively. Especially if a four-hour bar closes below the 8.66 dollar level, it can accelerate the decline significantly. The resistance levels to be followed for Avax are 9.38 / 9.85 and 10.23 dollars, respectively.

Solana Chart Analysis
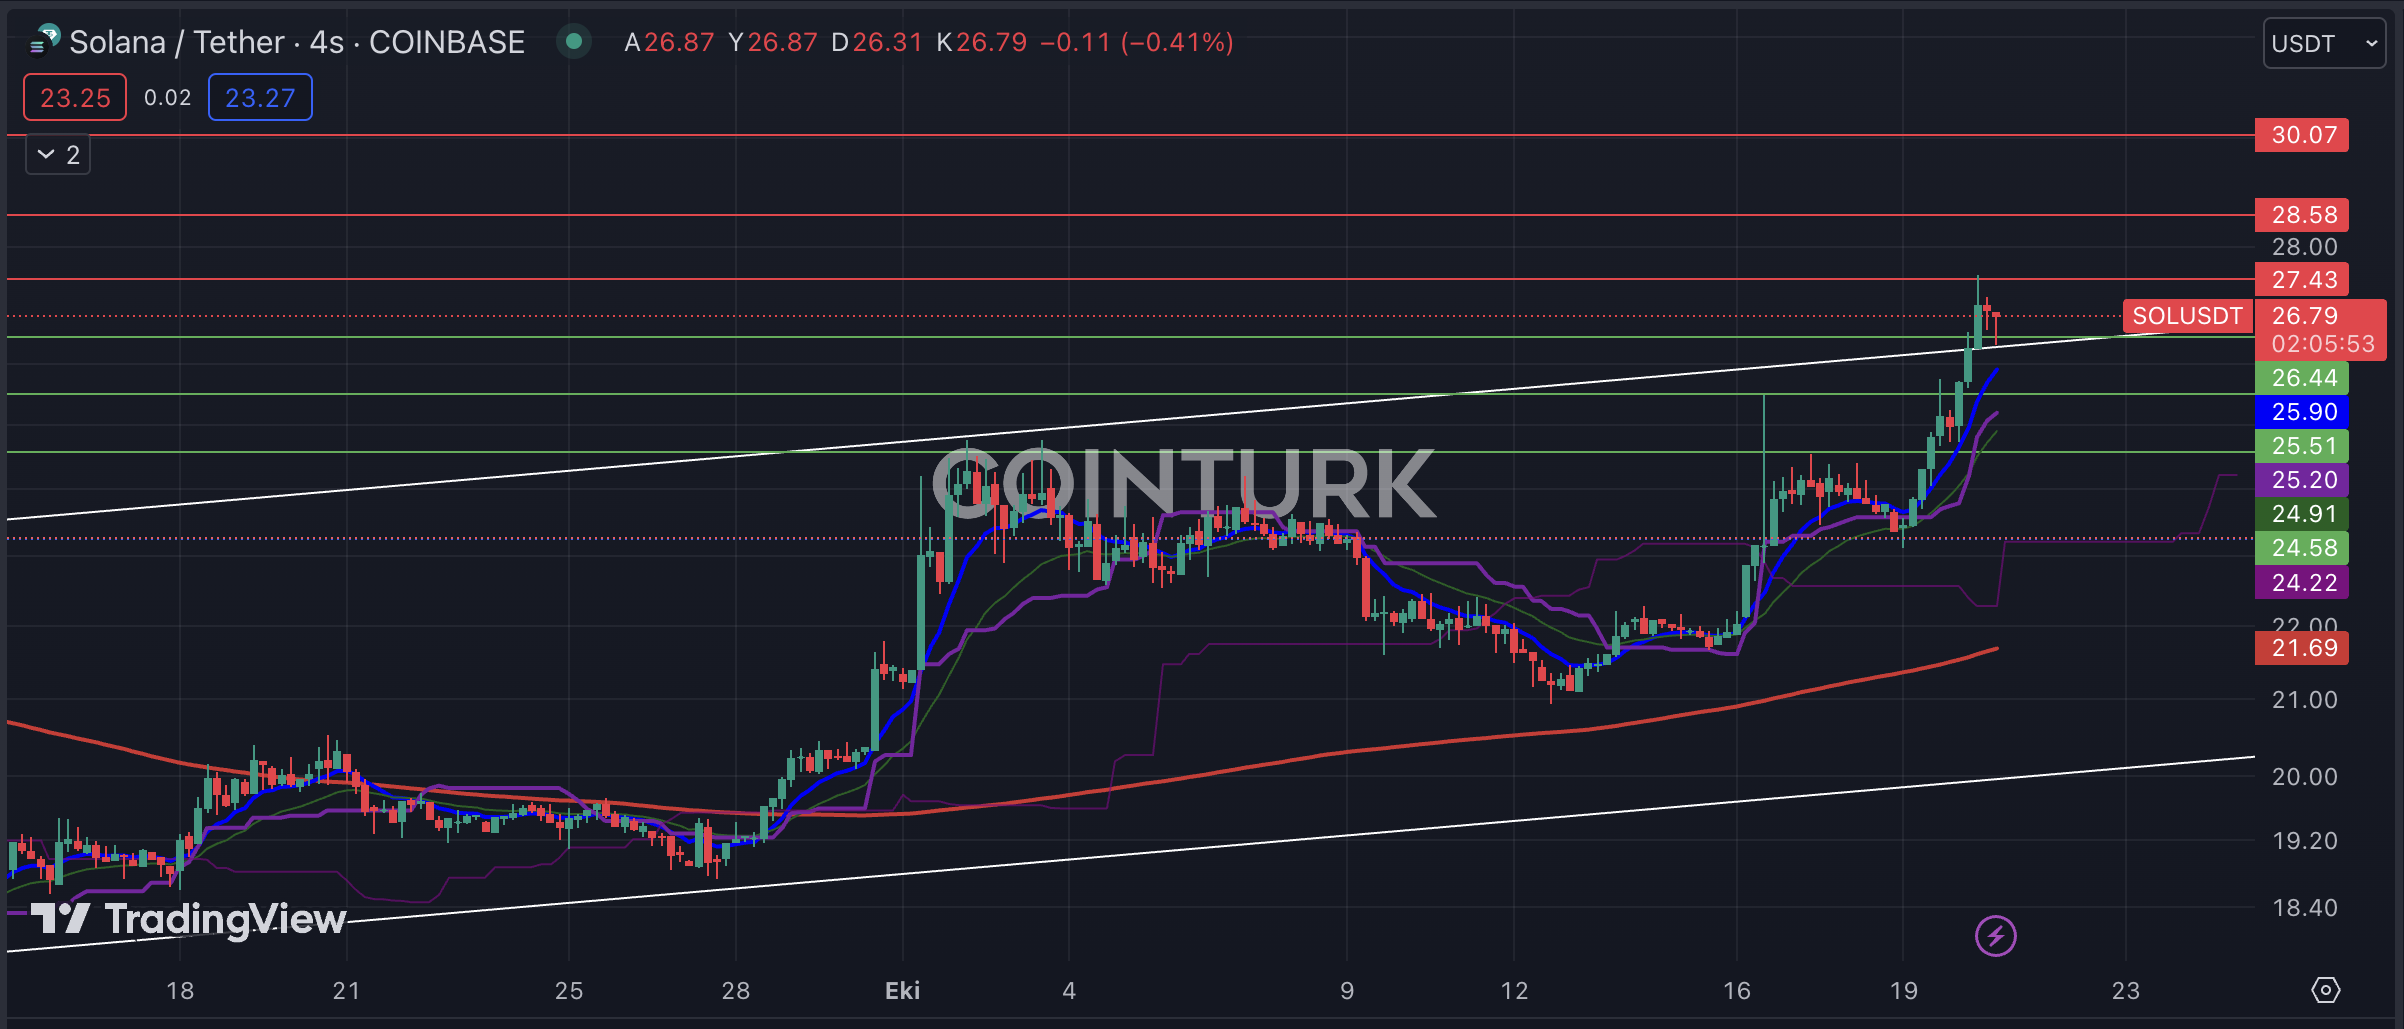
The rising channel formation in the four-hour chart of Solana, which has been negatively affected by the recent developments in the FTX case, is noteworthy. At the time of writing, Solana broke the formation resistance and tested this line as support, which can ignite the rise at any moment.
The support levels that should be noted in the four-hour chart for Solana are 24.58 / 25.51 and 26.44 dollars, respectively. Especially if a bar closes below the 26.44 dollar level, the price may return to the formation and the possibility of a rise will be put aside. The resistance levels to be followed for Solana are 27.43 / 28.58 and 30.77 dollars, respectively.

Chiliz Chart Analysis
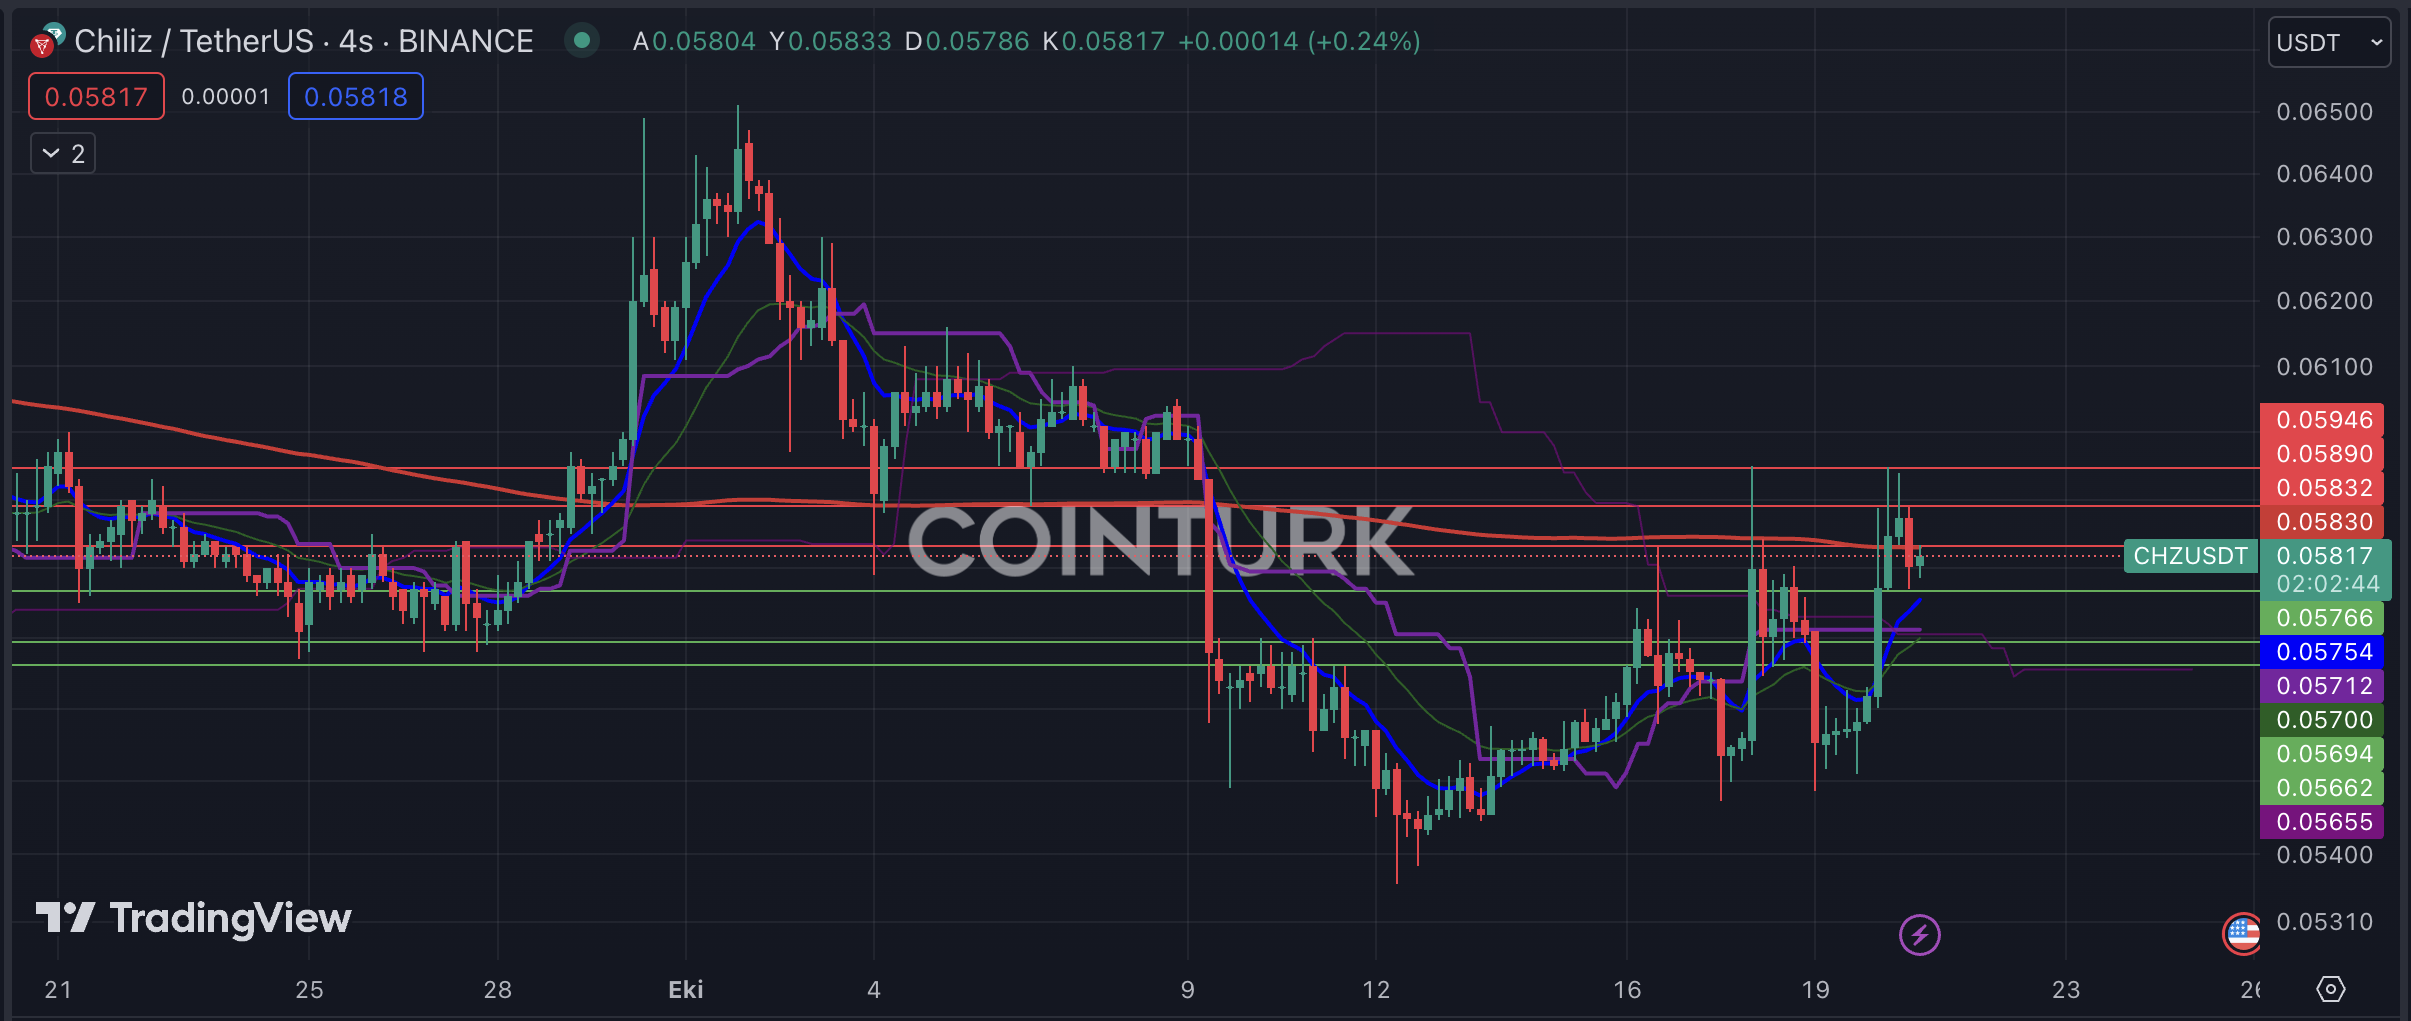
There is no healthy formation structure in the Chiliz chart, indicating a decrease in interest in the CHZ/USD pair. With the developments in the market, the main focus for the rise of CHZ should be a development related to news. In this way, investor interest will be redirected to this token again.
The support levels that should be noted in the four-hour chart for CHZ are 0.05662 / 0.05694 and 0.05766 dollars, respectively. Especially if a four-hour closing below the 0.05766 dollar level occurs, it will increase the downward momentum. The resistance levels to be followed for CHZ are 0.05832 / 0.05890 and 0.05946 dollars, respectively.


 Türkçe
 Español


