





Hyperliquid‘s native token HYPE is under increased scrutiny as analysts point to a possible downside move, following a strong week of gains. At last check, HYPE traded at $84.00, representing a 1.8% drop in the past 24 hours but still up 8.31% over the last seven days. The token’s market activity remains robust, with a daily trading volume of $1.1 billion.
Key support level attracts market focus
Technical analysts have highlighted a potential head-and-shoulders top pattern emerging on the 12-hour HYPE chart, which could signal a sharp short-term correction. The pattern’s neckline, situated in the $76 to $78 range, is now the main level observers are watching for confirmation of further declines.
If HYPE closes below this neckline for at least one 12-hour candle, analysts say the pattern will be validated, opening the door to notable downside targets. The first major support sits at $62, with the ultimate target at $59—representing a possible 22% retracement from the neckline area. Both are significantly below the current market price.
Technical specialist Ali Charts recently described this scenario, stating that a confirmed break below $76 would activate these targets. Until such a close occurs, the bearish formation remains unconfirmed. Conversely, any rebound from the neckline zone or a move above the right shoulder’s high would challenge the bearish outlook.
The setup highlights $76–$78 as the level to watch on HYPE’s 12-hour chart, with a confirmed close below that range signaling a potential 22% correction toward $59.
Leveraged positions exposed to volatile swings
CoinMarketCap has mapped out the key liquidation zones for HYPE, indicating areas where forced liquidations could escalate volatility. According to its latest data, $612.39 million in long positions could be at risk if the price declines further, while shorts positioned above current prices make up $410.62 million.
The most substantial concentration of short positions, worth $37.49 million, sits at $110.15—well above the current price. Meanwhile, $17.15 million in long positions rest just below the neckline area at $78.35, putting them at risk in the event of a drop below the key support.
A move toward either level could result in liquidations, intensifying market movements. The liquidation map illustrates the delicate balance between long and short interest at these critical thresholds.
CoinMarketCap’s data shows that leveraged traders in both directions are vulnerable, highlighting $78.35 as a pivotal level for those holding long positions.
Monitoring key support levels in real time
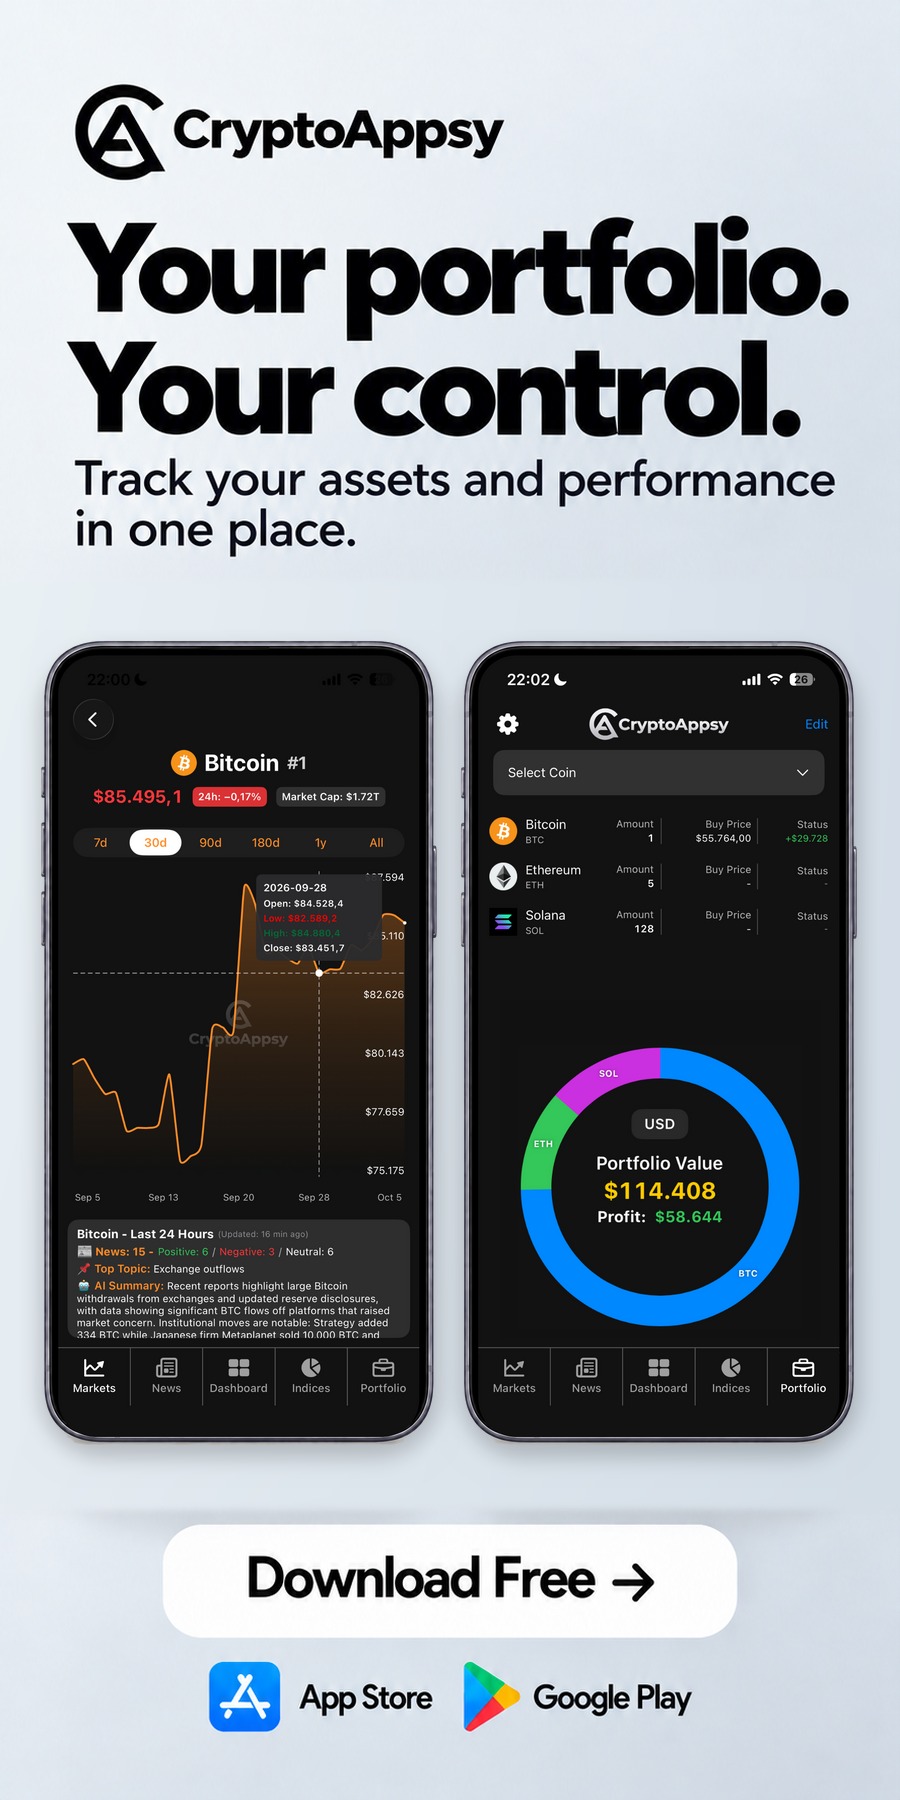
For traders tracking HYPE’s volatility around the $76–$78 support, tools providing quick updates on sudden movements are essential. CryptoAppsy allows users to set instant price alerts for exact levels, such as the neckline zone under watch. This enables timely responses to potential breakouts or breakdowns, giving traders a practical edge during periods of heightened risk.