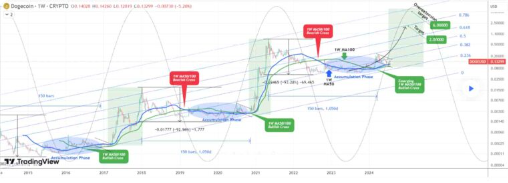
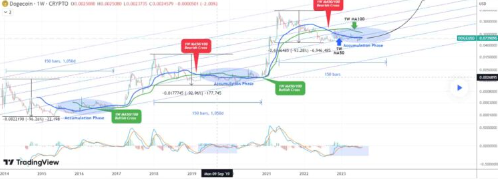
Meme coin leader Dogecoin (DOGE) continues to stay in the positive zone with a 1.68% weekly gain. Despite the bearish market outlook, DOGE has not lost all its weekly gains, and analysts remain optimistic about its upward trend. A chart shared by TradingShot on July 24 suggests that Dogecoin might be repeating past price movements.
DOGE’s History
According to the analysis, from 2014 to 2017, Dogecoin experienced a decline followed by an accumulation phase. During this 3-year period, DOGE’s price plummeted by an incredible 96.26%, hitting a low of $0.002198. After the decline, Dogecoin remained in a consolidation zone for approximately 1,050 days (150 weeks).

Following this period, from 2017 to 2018, the price movement indicated a rally. However, things changed from 2018 to 2019, and Dogecoin showed a downward trend. This decline reached 92.96%, causing panic among investors. The events followed a cycle, and after hitting the bottom, a new accumulation phase began.
Since 2020, Dogecoin appears to be in a new accumulation phase. Considering past price movements, this phase seems to parallel previous events and suggests consolidation before a potential new breakout.
DOGE Comments
Looking at the DOGE chart, the first support level is seen between $0.07 and $0.08, sustained by the 1-week moving average line. This level has previously served as significant support during accumulation phases and can be considered a precursor to potential breakouts.
The next deeper support level is found around the $0.002198 region, which was one of the critical levels during past accumulation phases.

Regarding resistance, the 0.236 Fibonacci retracement level at the $0.20 region marks an important point. For the upward movement to gain real momentum, surpassing this region is crucial. Beyond that, the resistance at the 0.618 Fibonacci level, located around the $2 region, remains distant and overly optimistic for now.

 Türkçe
 Español


