Technical and fundamental indicators for Solana, one of the popular cryptocurrency projects of recent times, have managed to attract the attention of analysts. According to the data and technical indicators, the popular altcoin project seems ready for a significant upward movement by March. So, what is expected for Solana, which was trading at $98.29 at the time the article was written? Let’s examine together.
Noteworthy Formation in the Solana Chart
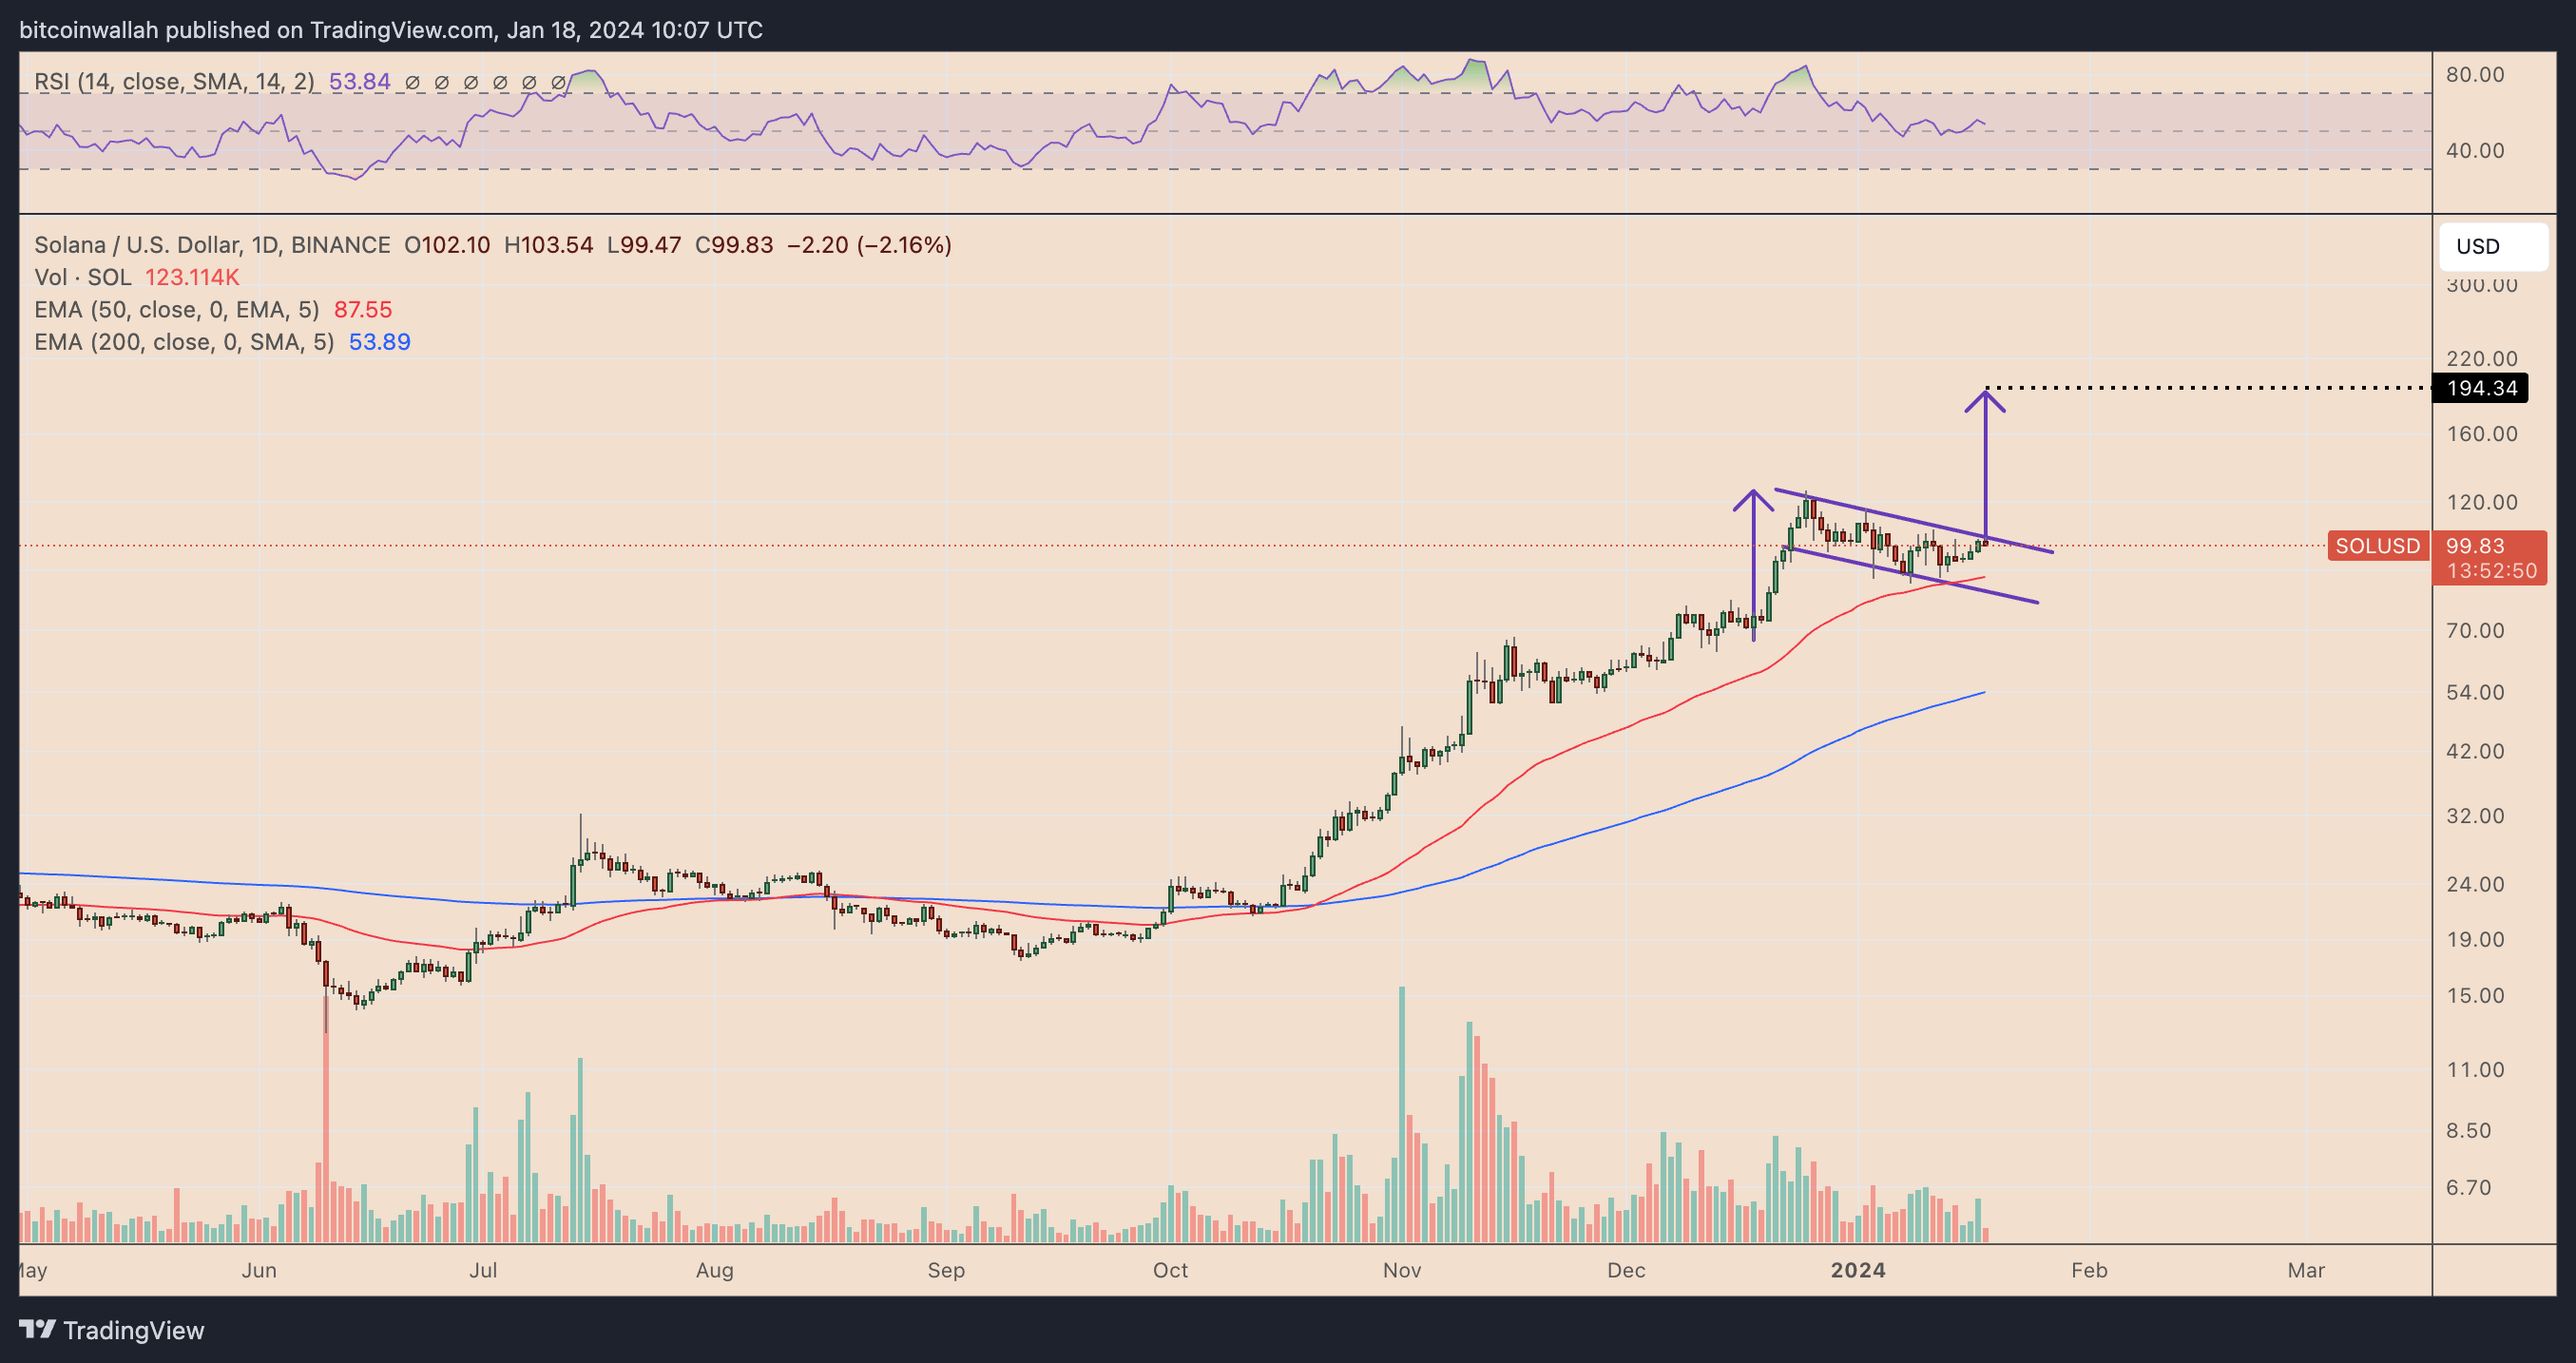
On January 18, the Solana price tested the upper trend line of a formation that appeared to be a bullish flag. A bullish flag formation is known as a continuation pattern that occurs after a strong upward movement, where the price moves within a downward-sloping channel. Typically, after the price breaks above the channel’s upper trend line and rises the height of the flagpole, these structures result in success. Therefore, Solana could break towards the $194 level, which is an approximate 80% increase from the current price levels, by March.

However, a pullback from the upper trend line could send the Solana price down towards the lower trend line around the $80 level. Moreover, Solana could witness horizontal price movement near the 50-day EMA level (red line) at around $87, a long-term support zone. Staying within the flag range will keep the likelihood of a breakout at the forefront.
ETF Speculations and Solana
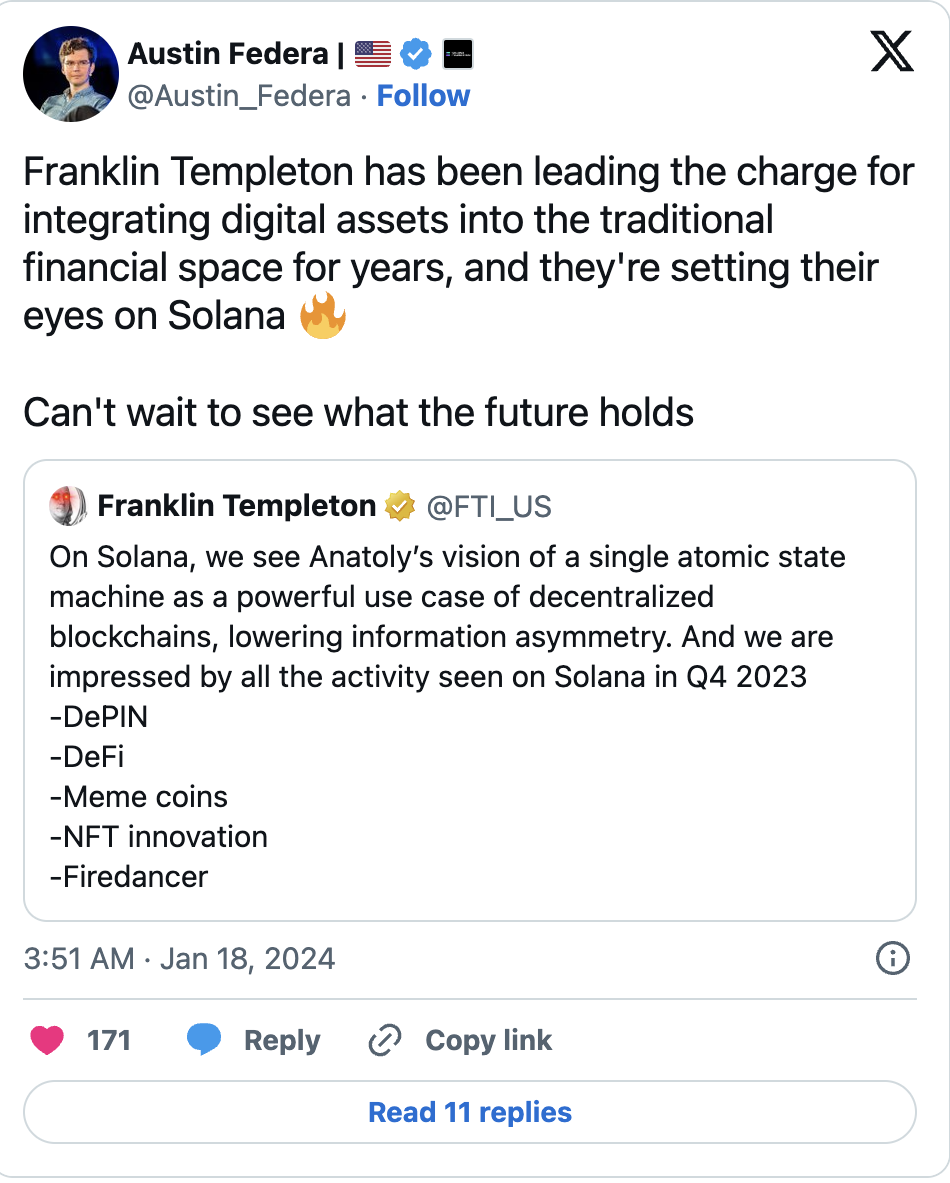
The approval of spot Bitcoin ETF products on January 11 increased industry hopes that other crypto assets, including Solana, could receive a spot ETF in the future. Asset management firm Franklin Templeton fueled Solana ETF speculations even further after praising the blockchain network following the hype in DeFi, infrastructure, NFT market, and memecoin projects. Expectations of a spot Solana ETF could lead to an increase in SOL price, similar to the rally Bitcoin experienced before the ETF approval.

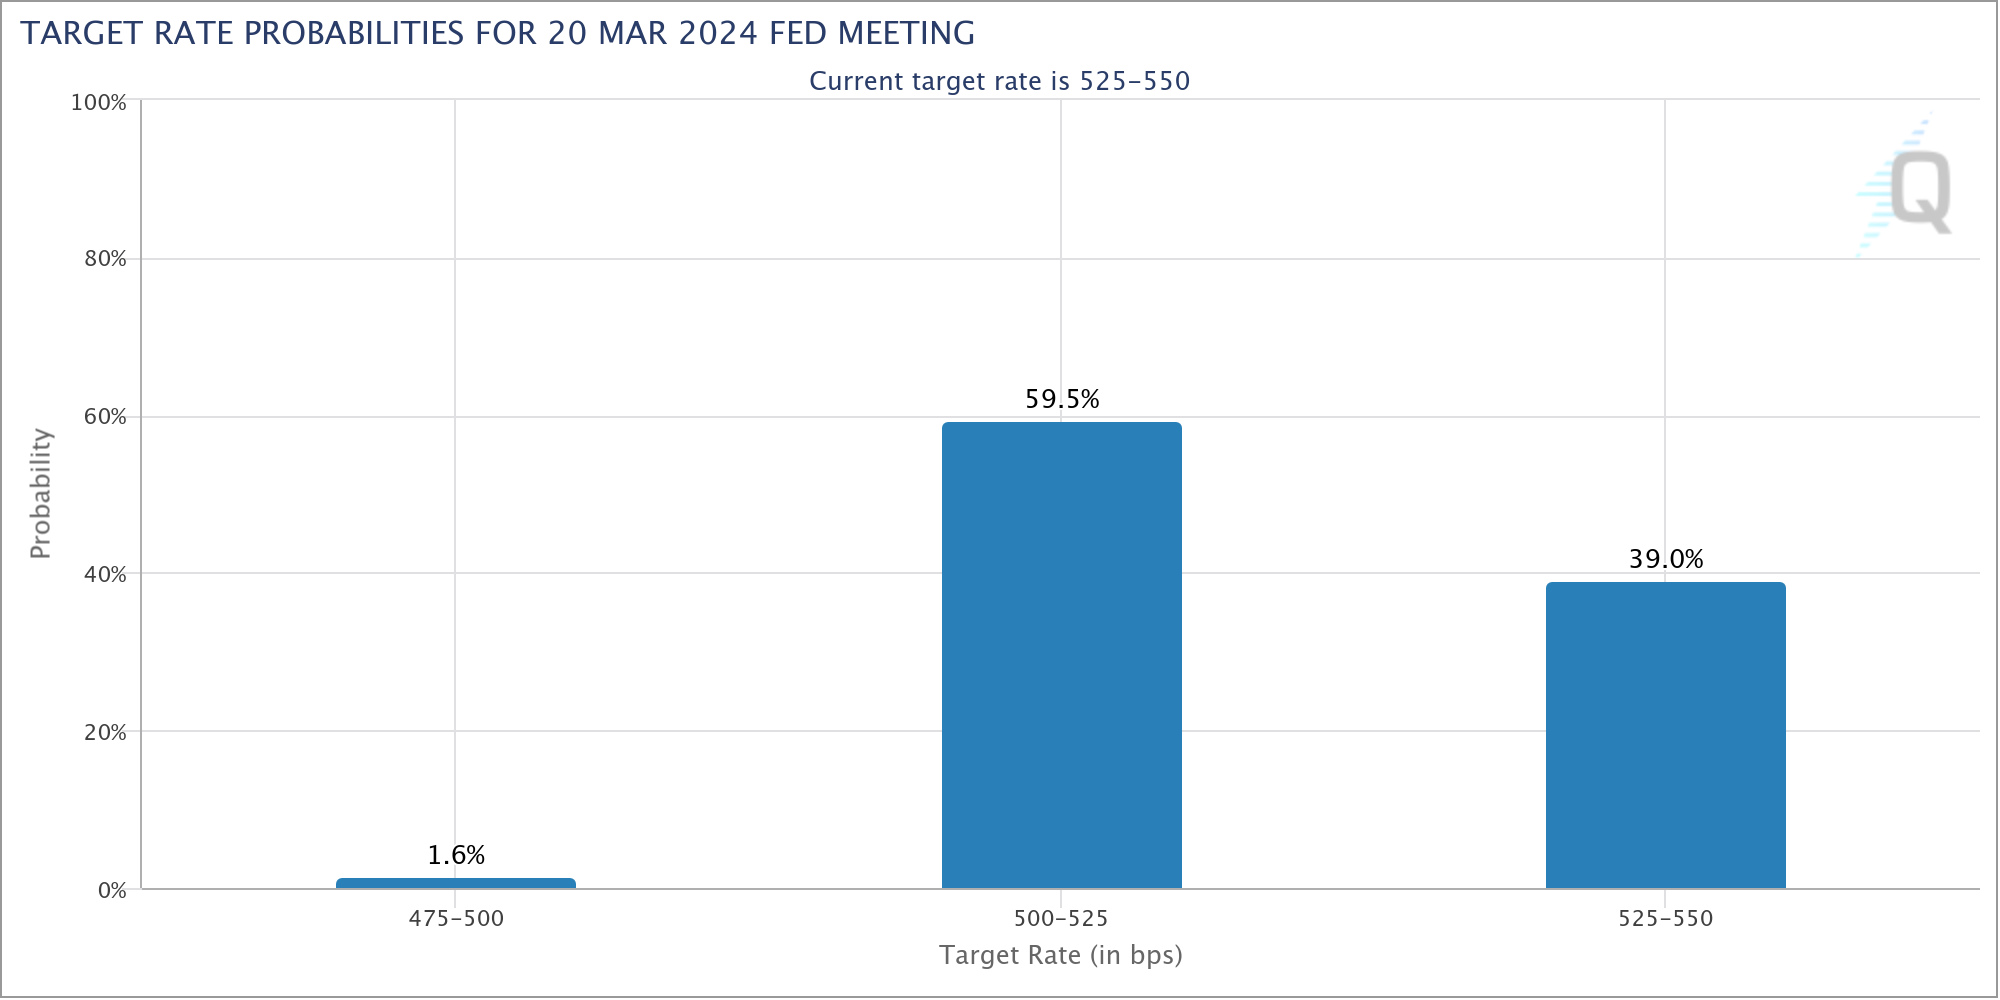
The CME‘s Fed fund rate futures predictions see a 25 basis point rate cut in the US by March 2024 with a probability of 59.5%. Lower interest rates can lead to a weakening of the US dollar as yields on dollar-denominated assets decrease. Cryptocurrencies like Solana, typically priced against the dollar, could gain value as the dollar weakens.

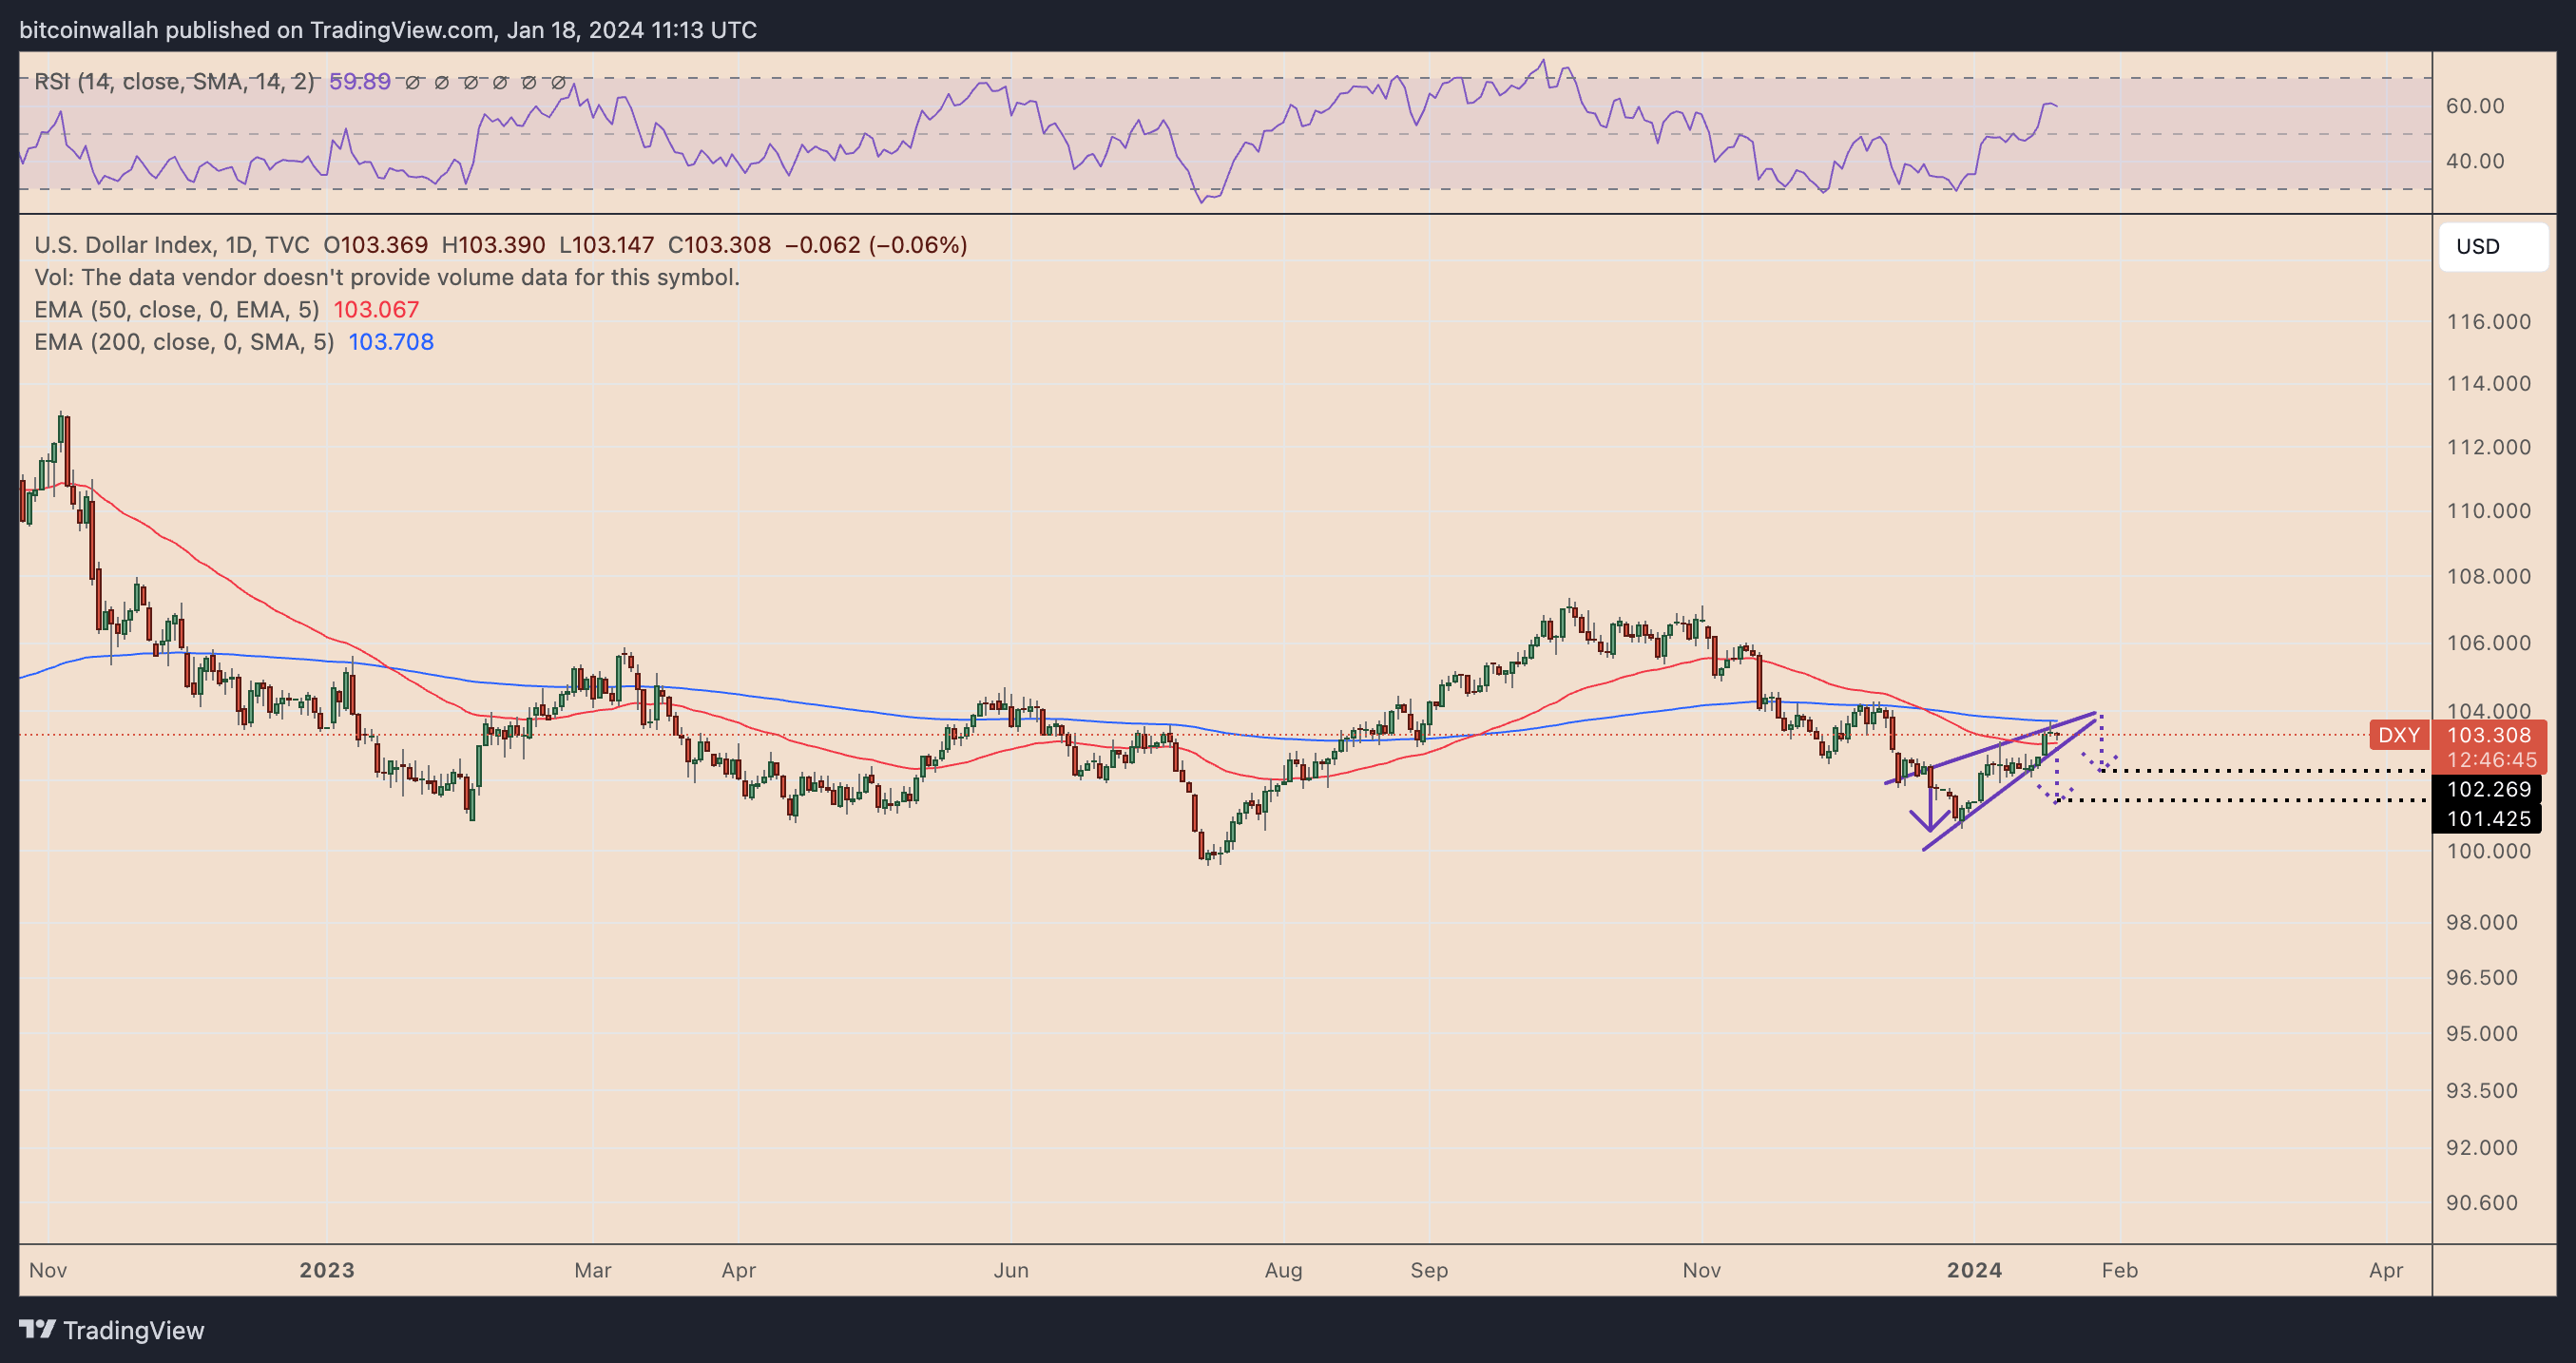
The technical structure of the US dollar index (DXY) indicates a potential sell scenario in the coming days. Particularly, the formation of a rising wedge since December 2023 and the downward target depending on the breakout point, which is expected to be between 101.50 and 102.25, strengthens this possibility. Therefore, the continuation of Solana’s inverse correlation with the US dollar increases the likelihood of a significant rally in SOL price by March.


