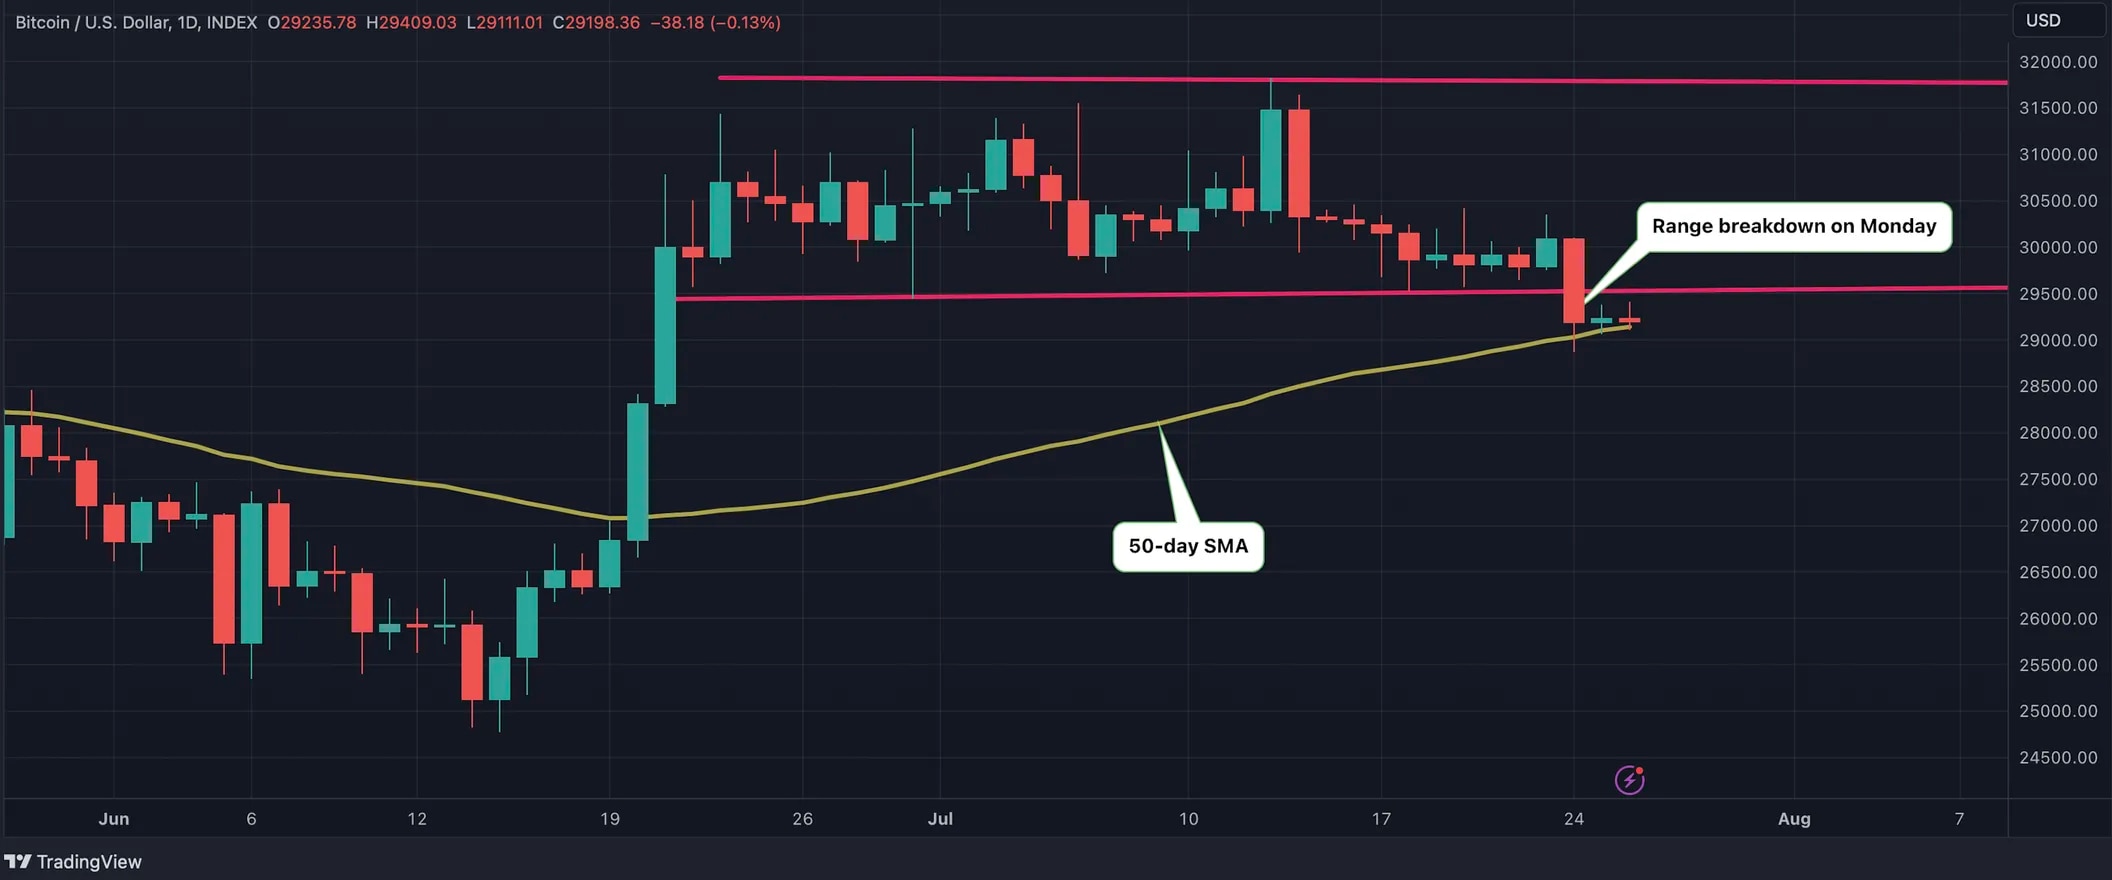
On the first day of the week, Bitcoin (BTC) lost over 3% of its value, dropping below the weekly trading range of $29,500 to $32,000. This break indicates the end of a three-week long-range play, with BTC’s downward movement stopping at around $29,140, where the 50-day Simple Moving Average (SMA) is located.
Analysts Identify Potential Downside Targets
Technical analysts, including Katie Stockton from Fairlead Strategies, closely monitor Bitcoin’s price movements and have warned that breaking the support at the 50-day SMA could worsen the outlook for Bitcoin.

Stockton pointed out that if there are two consecutive days of candle closes below the 50-day SMA, which is approximately $29,000, the price could drop to the long-term target level of $25,200. The cryptocurrency market being open 24/7 means there is no traditional daily closing, and analysts consider the price at 02:59 as the daily closing price in technical analysis.
Additionally, weekly chart indicators suggest a potential move below the 50-day average. The Relative Strength Index (RSI), used to measure overbought and oversold conditions, often shows an overbought decline before price retracements. Furthermore, the Moving Average Convergence Divergence (MACD) on the weekly chart is squeezed towards a ‘sell’ signal, indicating a possible decline in BTC’s price.
Although the market finds temporary balance, the concentration of downward pressure below the 50-day SMA still poses the risk of a deeper decline. According to Alex Kuptsikevich, a senior market analyst at FxPro, the next significant support level could be around $27,000, which is the lower boundary of the rising channel from the lowest levels of November 2022 and the 200-week moving average.
Investors Await Fed, ECB, and BoJ Interest Rate Decisions
In summary, Bitcoin’s price falling below the long-held trading range has raised concerns among technical analysts about potential losses. If BTC fails to maintain the key support at the 50-day SMA, the downside risk will increase, potentially leading to a move towards the long-term support at $25,200. While the risk of a deeper decline persists, the next significant support level before the $25,200 support could be $27,000.
Investors closely monitor weekly chart indicators that suggest a possible decline while also awaiting central bank interest rate decisions that could complete the market consolidation and determine the trend for the coming weeks. In this context, the interest rate decisions announced by the US Federal Reserve (Fed), the European Central Bank (ECB), and the Bank of Japan (BoJ) will be closely watched throughout the week.


 Türkçe
 Español


