Technical analysis in the cryptocurrency market is a necessary indicator that investors, especially those trading in the futures market, need to keep a constant eye on. So, what clues does technical analysis give us for Arbitrum, trading at $1.14 at the time of writing, and Optimism, trading at $2.17? We examine in detail with important support and resistance levels.
Arbitrum Chart Analysis
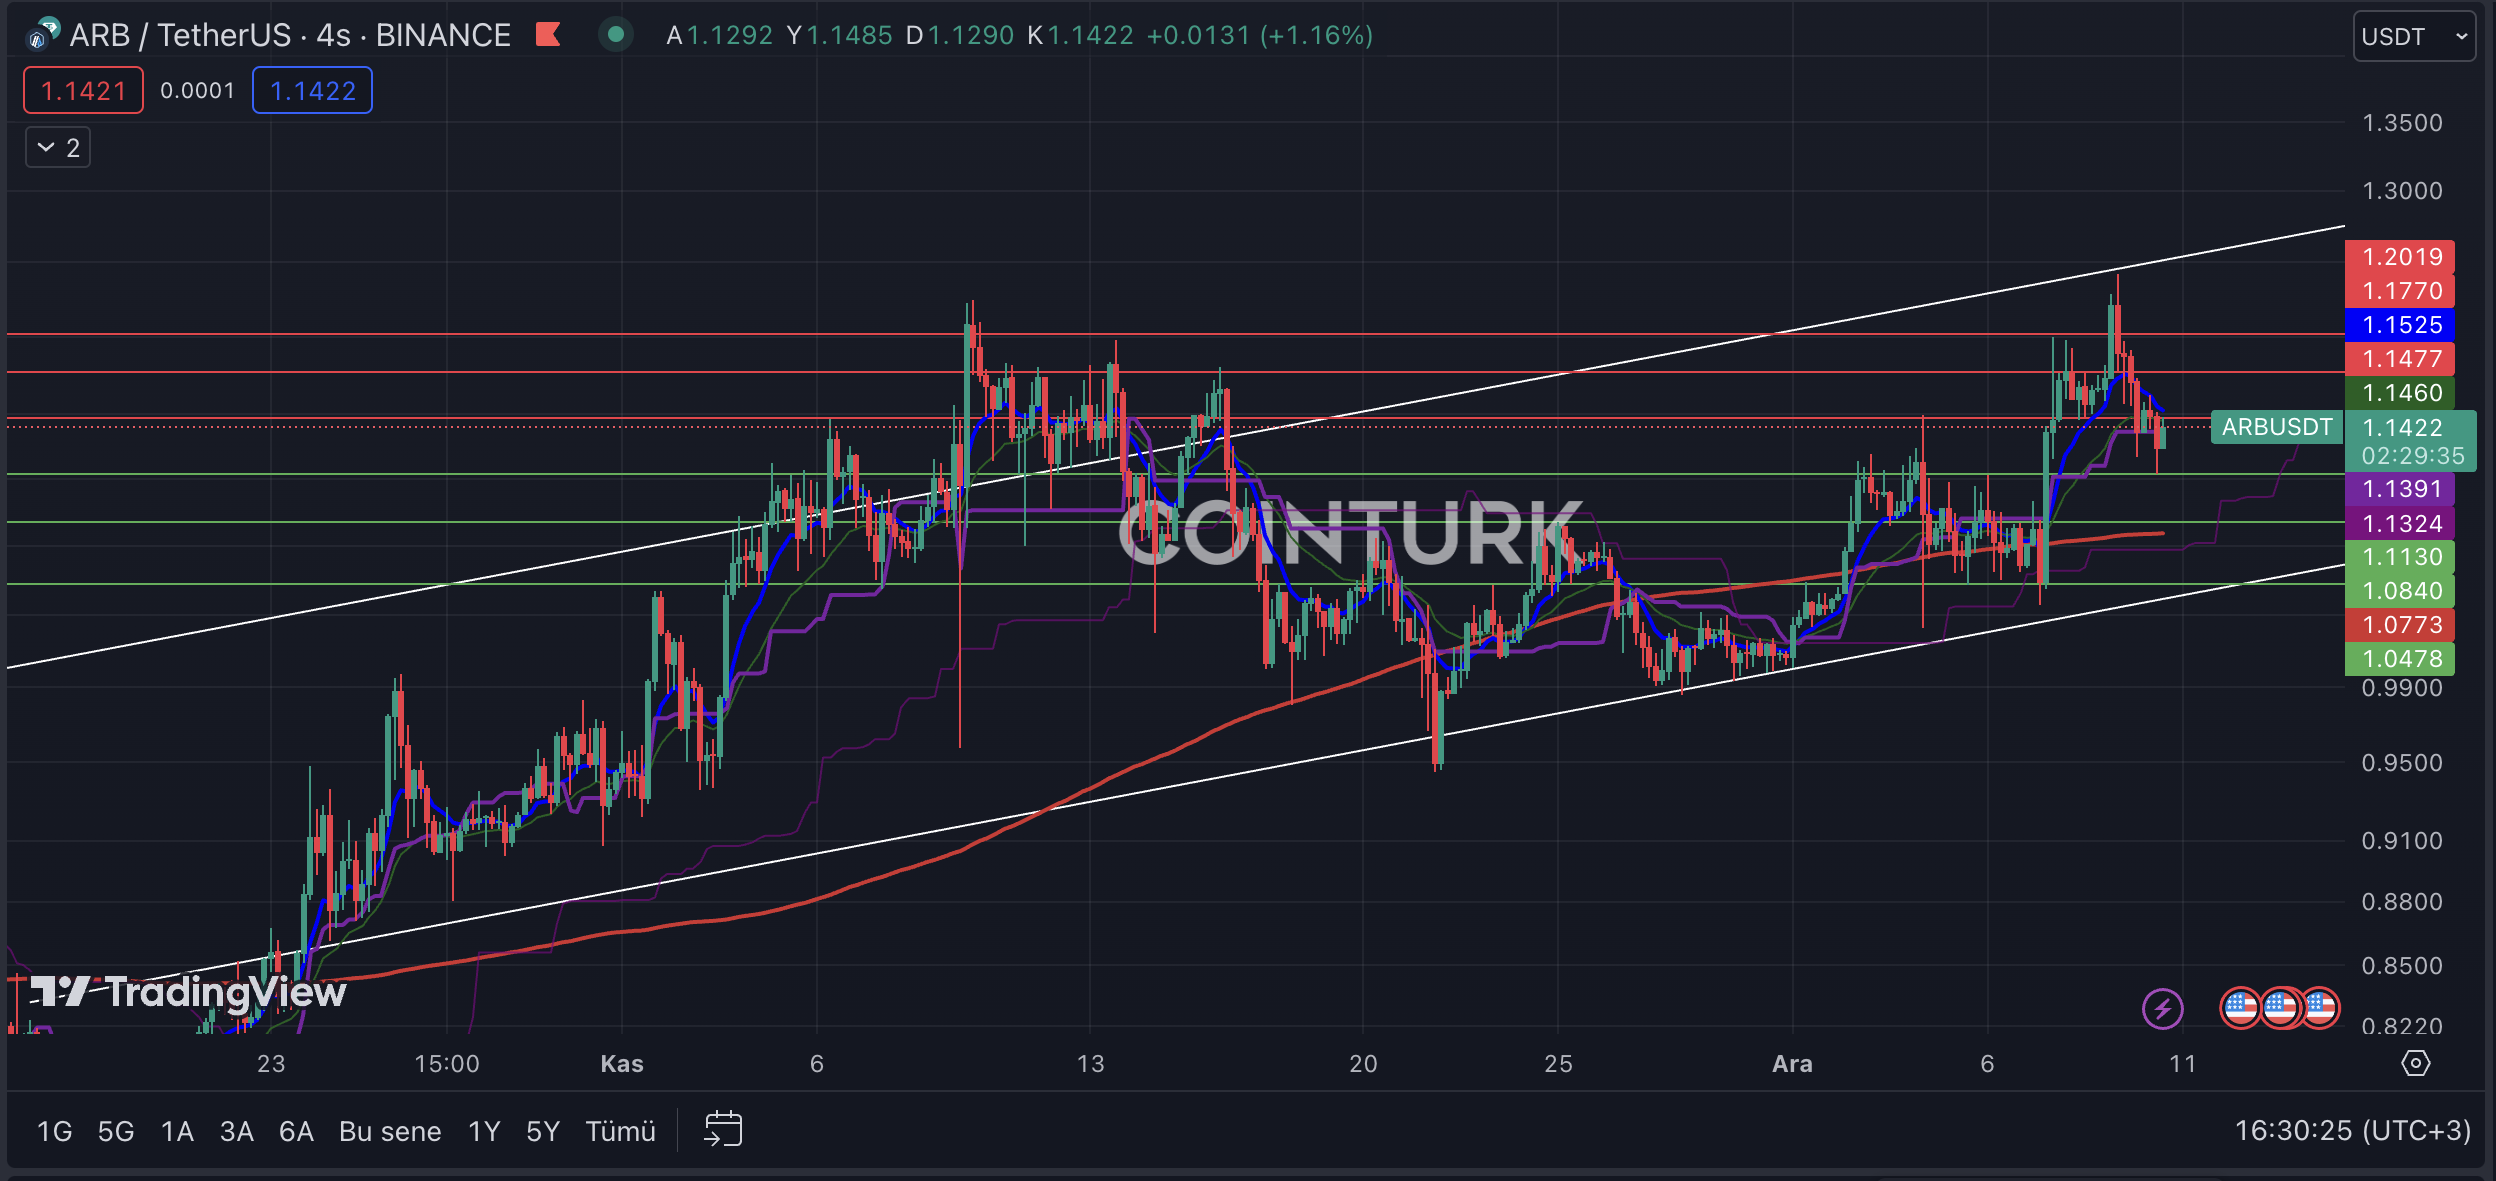
The most notable formation structure in the four-hour ARB chart is the rising channel formation, commonly seen in the altcoin market these days. In this structure, the resistance line’s failure to achieve the desired rise between November 6 and 13 has caused many investors to lose money in the futures market. The serious correction in the price following the touch to the resistance line in the last rise move signals a negative process for ARB.
The most important support levels to follow in the four-hour ARB chart are respectively; $1.11 / $1.08 and $1.04. Especially if a four-hour bar closing occurs below the $1.11 level, which played a significant role in the last selling pressure, it may cause ARB price to face selling pressure.
The most important resistance levels to watch out for in the four-hour ARB chart are respectively; $1.14 / $1.17 and $1.20. Especially, a four-hour bar closing above the $1.17 level that intersects with the EMA 7 (blue line) level will accelerate the ARB price.

Optimism Chart Analysis
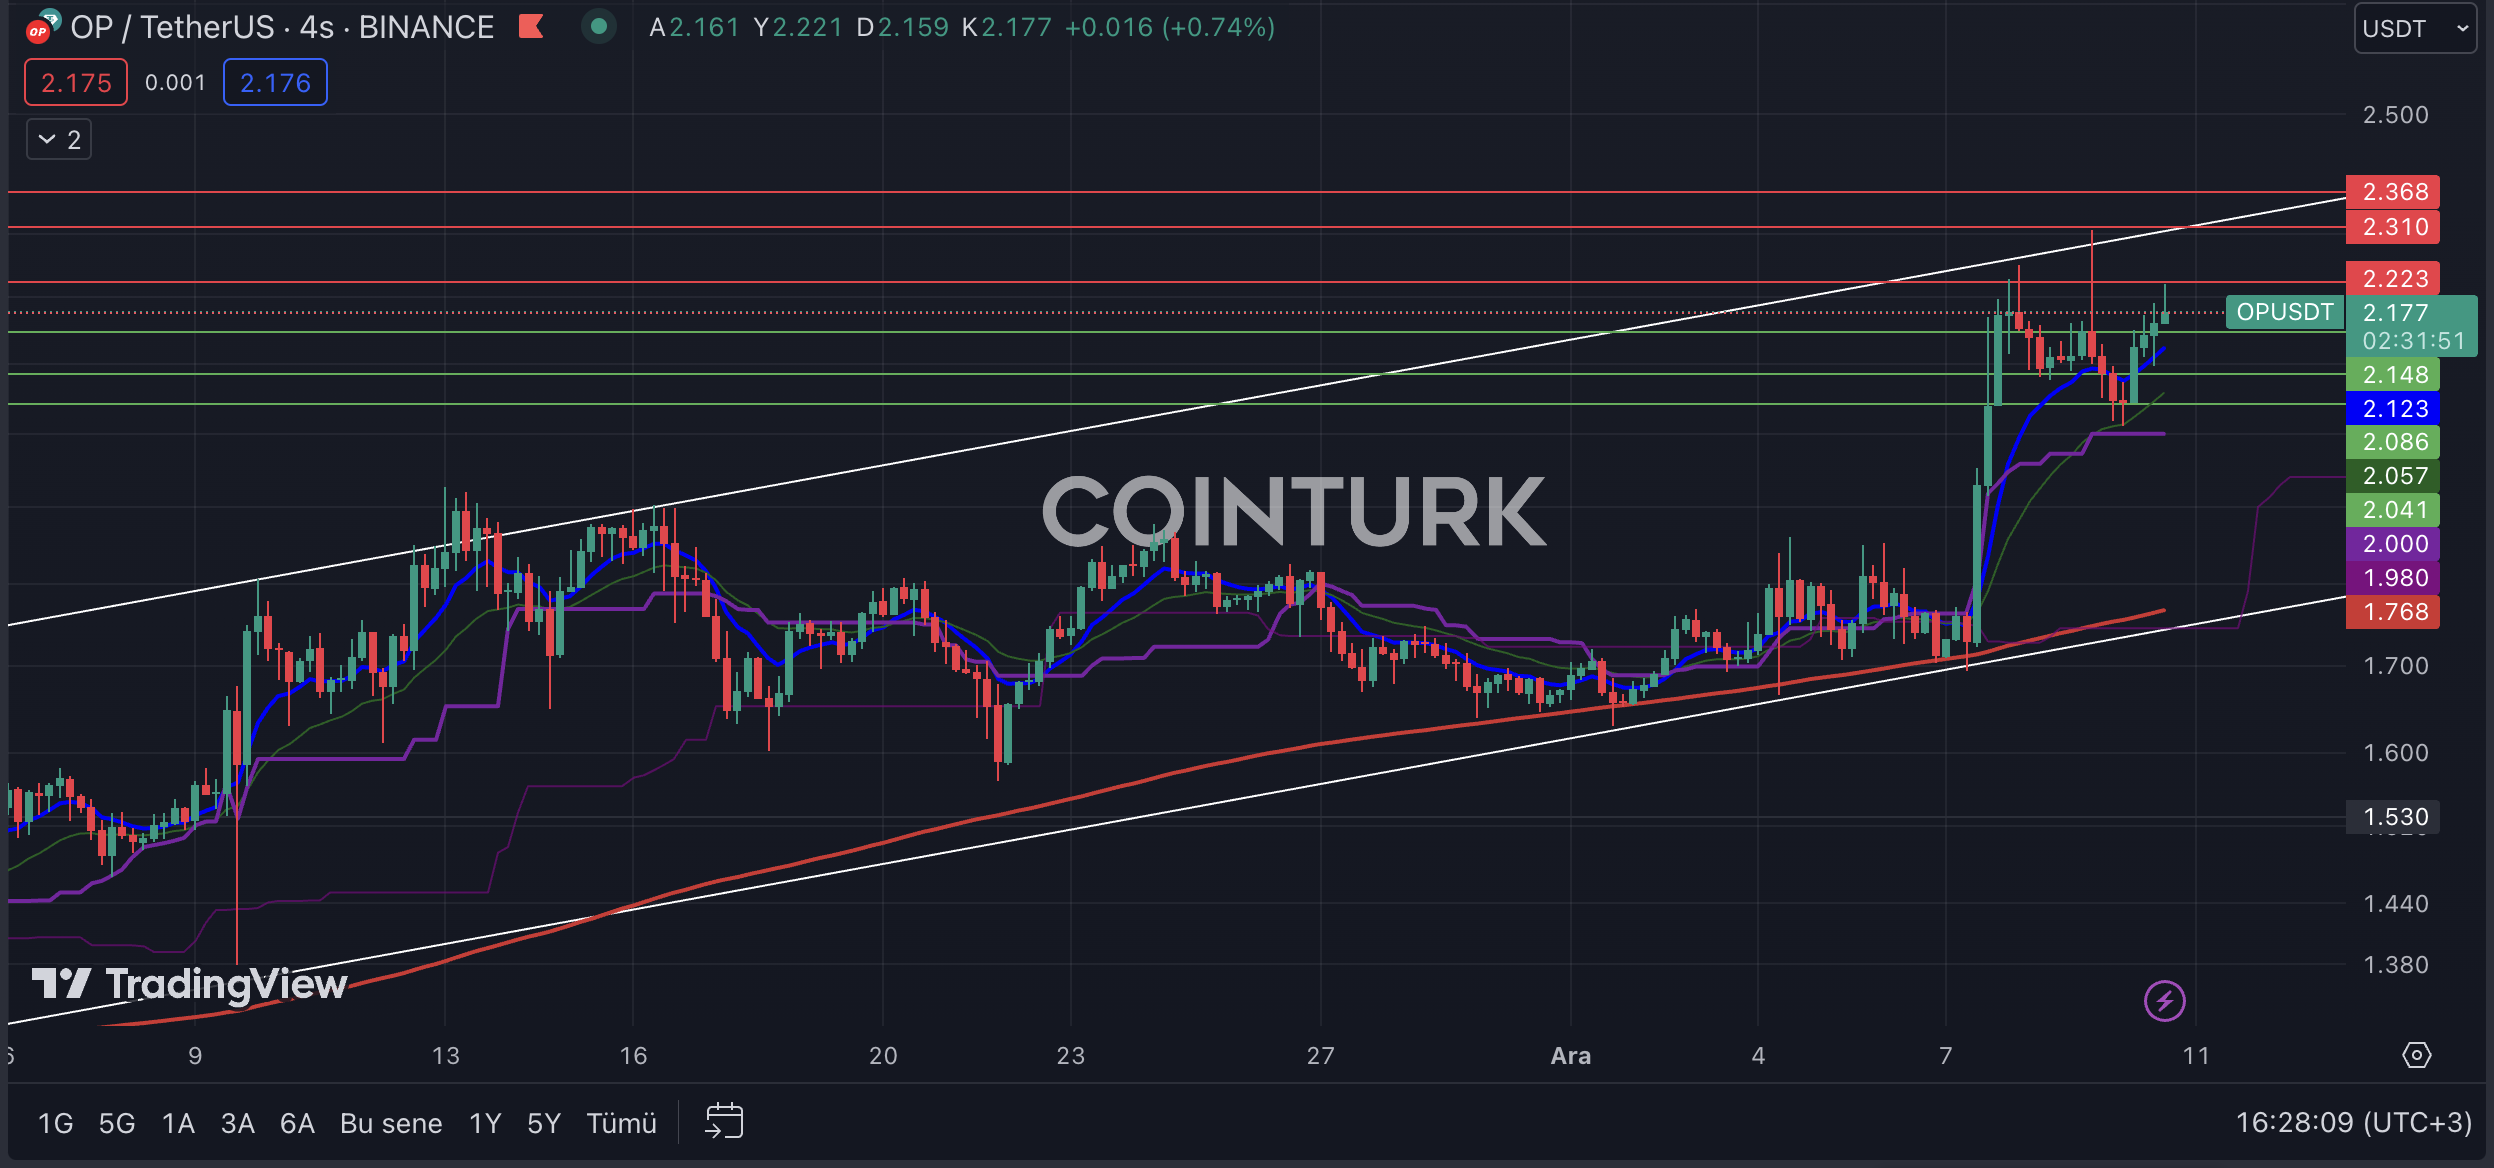
Like Arbitrum, the most notable formation structure in the four-hour Optimism chart is the rising channel formation. The support line intersecting with the EMA 200 (red line) level plays an important role, and after the last resistance touch, the price finding support at the EMA 21 (green line) level sets a positive scenario for OP price.
The most important support levels to monitor in the four-hour chart for OP are respectively; $2.14 / $2.08 and $2.04. Especially, if a four-hour bar closing occurs below $2.04 level, it will cause the price to face selling pressure.
The most important resistance levels to watch out for in the four-hour chart for OP are respectively; $2.22 / $2.31 and $2.36. Especially, a bar closing above the $2.31 level intersecting with the formation resistance line will accelerate the OP price.


 Türkçe
 Español


