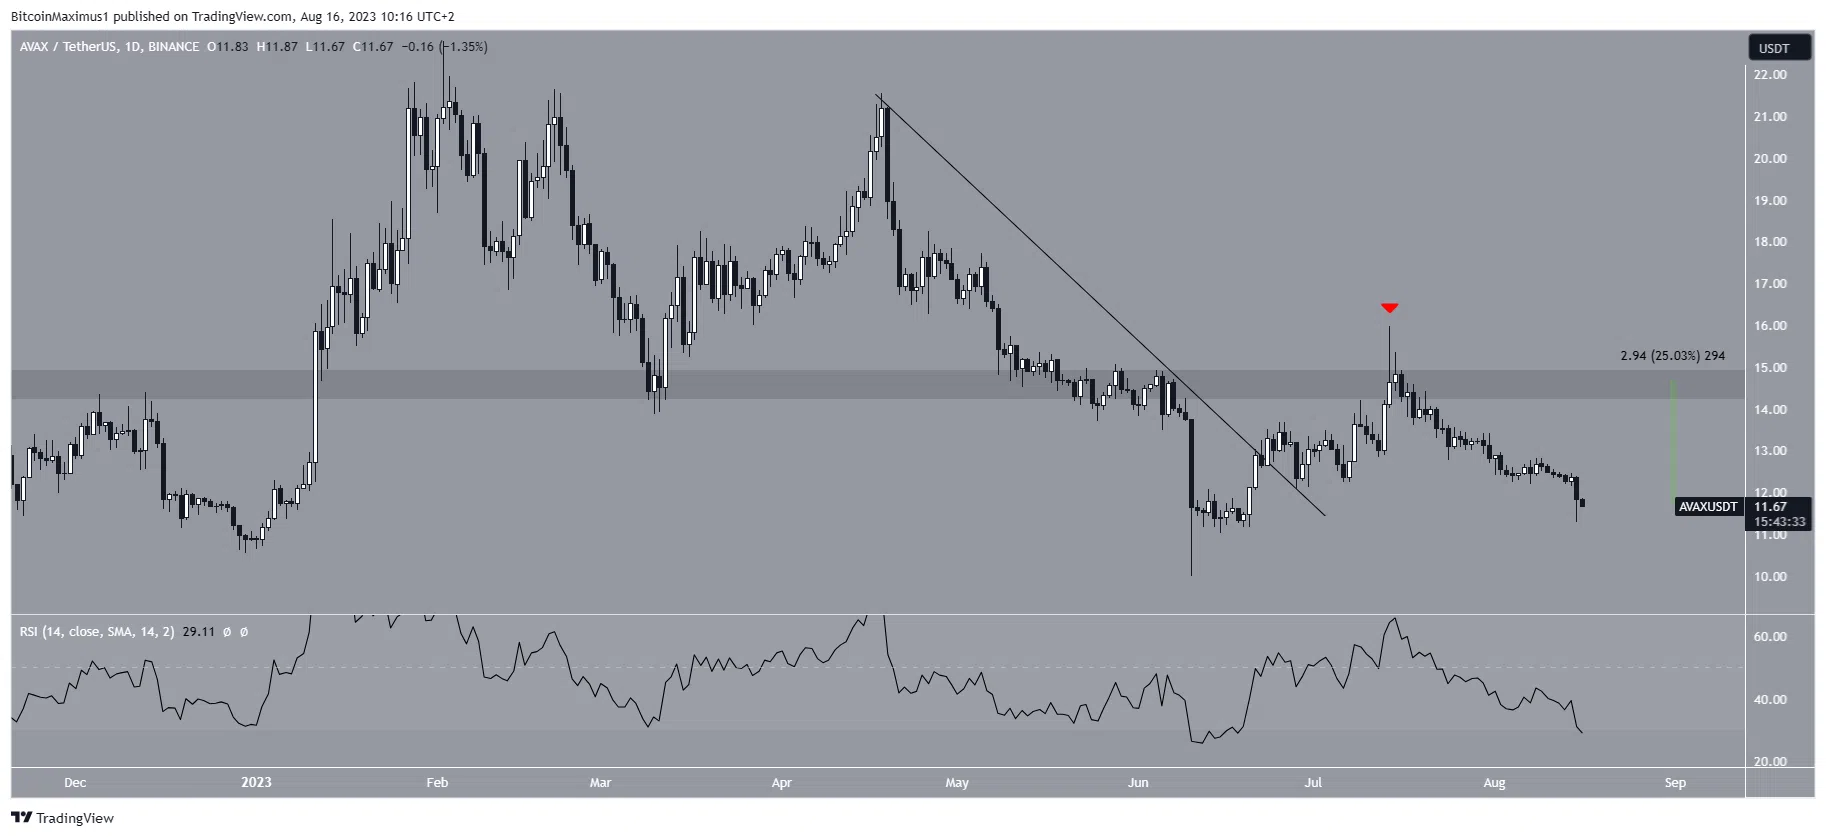
Avalanche (AVAX) is at risk of breaking out of a long-term horizontal support area that has been in place for 938 days. If this occurs, it could have significant downward effects on the price, potentially leading to a 50% drop, according to experts.
AVAX Price Analysis!
Since reaching its all-time high of $147 in November 2021, the Avalanche price has dropped below a descending resistance line. The last touch on this line occurred in March 2022. During the decline, the price bounced twice at the horizontal support level of $11.50 in January and June 2023.
The second bounce created a long lower wick, which is considered a sign of buying pressure. The $11.50 region is crucial as it has been in place for 938 days. However, AVAX has failed to initiate any upward movement. Instead, the price has dropped and is currently trading just above the $11.50 support area, well below the descending resistance line, which is currently at $20.
This situation has occurred despite the distribution of Uniswap V3 on the Avalanche network. The weekly RSI is showing a downward trend. Market investors use RSI as a momentum indicator to determine overbought or oversold conditions and decide whether to accumulate or sell a token.

AVAX Price Prediction!
Readings above 50 on the RSI and an upward trend indicate that bulls still have an advantage, while readings below 50 indicate the opposite. The indicator is below 50 and falling, both of which are seen as signs of a downward trend. The daily timeframe technical analysis also suggests a downward trend.
In the cryptocurrency unit, the main reason for this is considered to be the rejection from the horizontal area of $14.50 followed by a decline.
Additionally, the rejection is claimed to have occurred after a breakout from a short-term descending resistance line. The failure to reclaim the $14.50 area after the breakout could be another sign of a further decline. The fact that the price is now trading below the breakout level could indicate that the breakout was not legitimate. Moreover, the daily RSI is below 50 and falling, which could also be a sign of a downward trend.
In conclusion, a breakout from the long-term horizontal support area of $11.50 could be the most likely price scenario in the future. If this happens, a 50% drop to the next support at $6 could potentially be the future price outlook.


