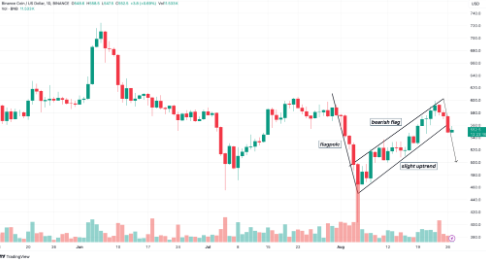
Binance Coin (BNB) may face a new price decline. Earlier this month, BNB experienced a 20% increase following a significant drop on August 5. However, in the last 24 hours, the cryptocurrency’s value has decreased by 1%, indicating a possible new decline.
Binance Coin (BNB) Analysis
As of the time of writing, BNB coin continues to trade at $546. The daily chart shows the emergence of a bearish flag, suggesting that the recent downtrend may gain strength. A bearish flag typically appears when a downward trend connects the highest and lowest points of a short-term upward trend within a parallel channel.
Looking at the chart below, there is an almost vertical flagpole indicating how bulls initially lost strength against bears. This process is often followed by a profit-taking phase.

During the profit-taking phase, BNB’s price dropped from its periodic peak of $600 to $552. Despite the price pullback, the formation of a bearish flag suggests that the downtrend may not be over yet. If this formation is confirmed, BNB could experience another decline towards $500.
BNB Price Forecast
In the daily chart analysis of BNB’s price, Fibonacci retracement levels were crucial. These levels, known as Fib retracement levels, are typically horizontal lines indicating support and resistance levels.

Each Fibonacci level is expressed in specific percentages or ratios used to determine the highest and lowest points. Key levels include 23.6%, 38.2%, 50%, 61.8%, and 78.6%. If buying pressure increases for BNB, the altcoin’s price could move towards the next Fib level in the upper range.
However, considering the current downtrend and chart conditions, BNB’s price could fall to $526, where the 61.8% golden ratio is located. An increase in selling pressure could cause the price to drop below the $500 support level, potentially leading to a move towards $472.
If the situation reverses and the price rebounds, BNB could maintain the psychological support level of $500. In this case, the price could rise again to $564 and even $601.90.


