Bitcoin (BTC) reached an all-time high of $73,777 last week but then rapidly lost its gains, dropping to $64,500. Bitcoin is on track to close the week with a roughly 1% decrease from the previous week’s close. Here’s the price analysis for Bitcoin (BTC) and two popular altcoins!
Bitcoin (BTC)
Bitcoin made a sharp correction from $73,777 on March 14 and fell below the rising channel pattern’s support line on March 16. Bulls are trying to halt the decline at the 20-day exponential moving average. However, they may face resistance at the channel’s breakdown level. A sharp decline from the current level could increase the risk of a drop. If the 20-day EMA is breached, the BTC/USDT pair could fall to $59,000 and then to the 50-day simple moving average.
If bulls want to prevent a downward move, they may need to push the price back into the channel. This could indicate solid buying at lower levels. A breakout and close above $73,777 would indicate the uptrend has resumed. The pair could then rise to $80,000. Cryptocurrency moving averages have completed a bearish crossover, but the relative strength index (RSI) shows a sharp rise, indicating selling pressure may be decreasing. A sharp fall from the 20-EMA could indicate bears are selling on rallies. The pair could slide towards the strong support at $64,500. If this level is breached, the pair could fall to $59,000. The first sign of strength would be a breakout and close above the channel’s support line. The pair could then climb to $70,650 and later to $72,420.

Aptos (APT)
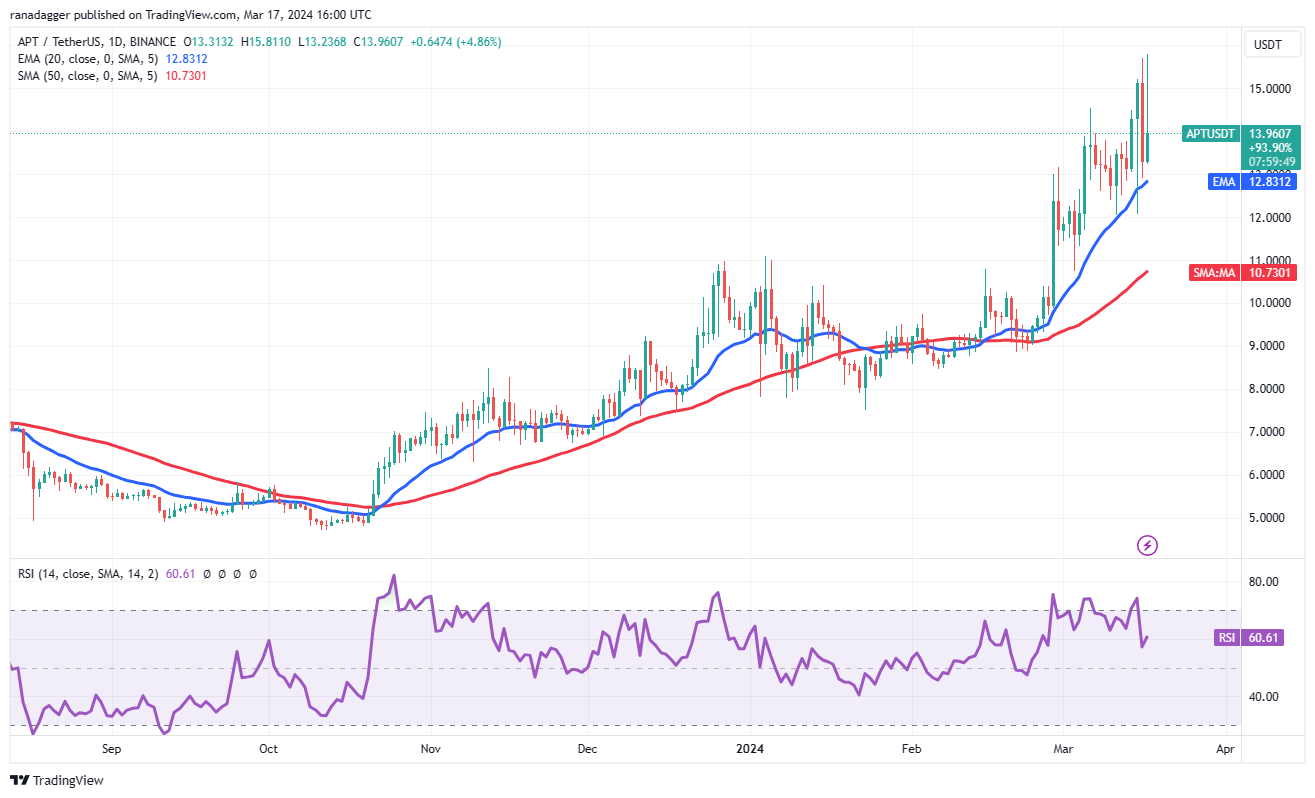
Aptos (APT) experienced a sharp decline from $15.70 on March 16 but bears could not pull the price below the 20-day EMA, which could indicate buying at lower levels. The rising 20-day EMA and the RSI in the positive zone could suggest that bulls have the upper hand. If buyers keep the price above $15.70, the APT/USDT pair could signal the start of the next leg of the uptrend. The pair could rise to $16.75 and then to $18.69. Experts suggest that if the price falls and retreats below the 20-day EMA, it could mean that all relief rallies are being sold. This could signal the start of a correction phase that could reach the 50-day SMA. The moving averages on the 4-hour chart have flattened and the RSI is just above the midpoint, signaling a potential short-term range-bound action. The pair could trade between $15.81 and $12 for a while. A close above the range could indicate that bulls have exhausted the supply, potentially starting the next leg of the upward move. Conversely, if the price falls and retreats below $12.92, the pair could start a correction towards $12 and then to $11.50.

Render (RNDR)
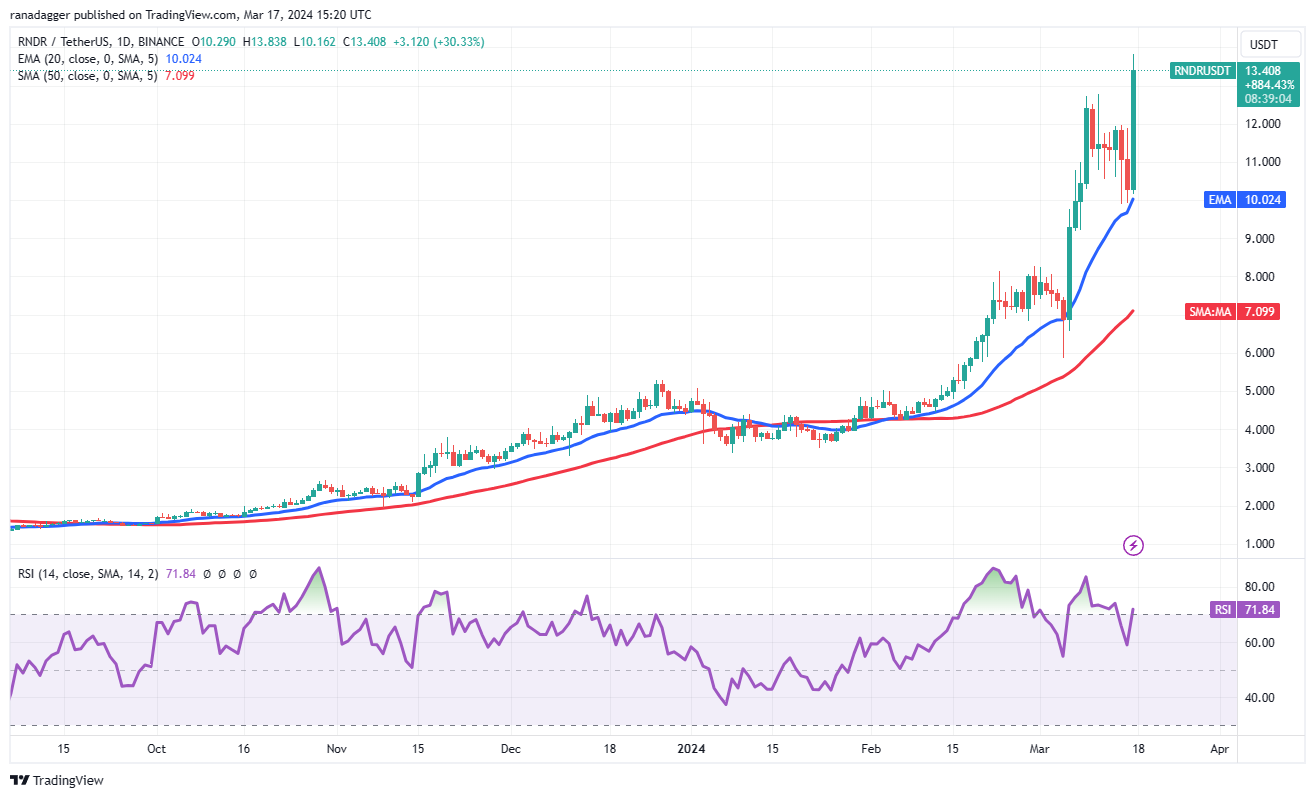
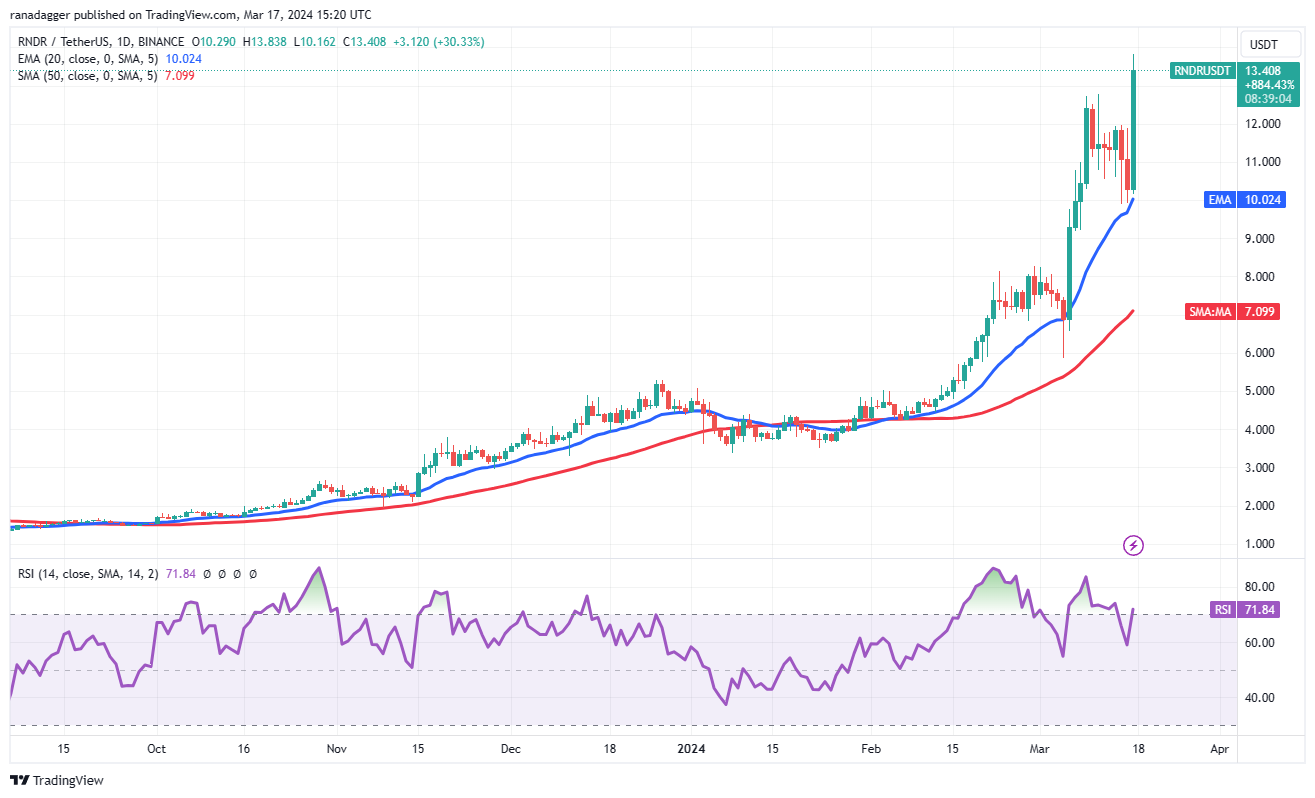
Render (RNDR) corrected to the 20-day EMA, but bulls successfully defended the support. This suggests that sentiment remains positive and investors are buying on dips. Bulls pushed the price above the resistance of $12.78 on March 17, potentially signaling the start of the next leg of the uptrend. If buyers maintain the price above $12.78, the RNDR/USDT pair could jump to $16.81. The first sign of weakness would be a drop below the solid support at $12. A break and close below the 20-day EMA could accelerate sales and drop the pair to the 50-day SMA.


 Türkçe
 Español


