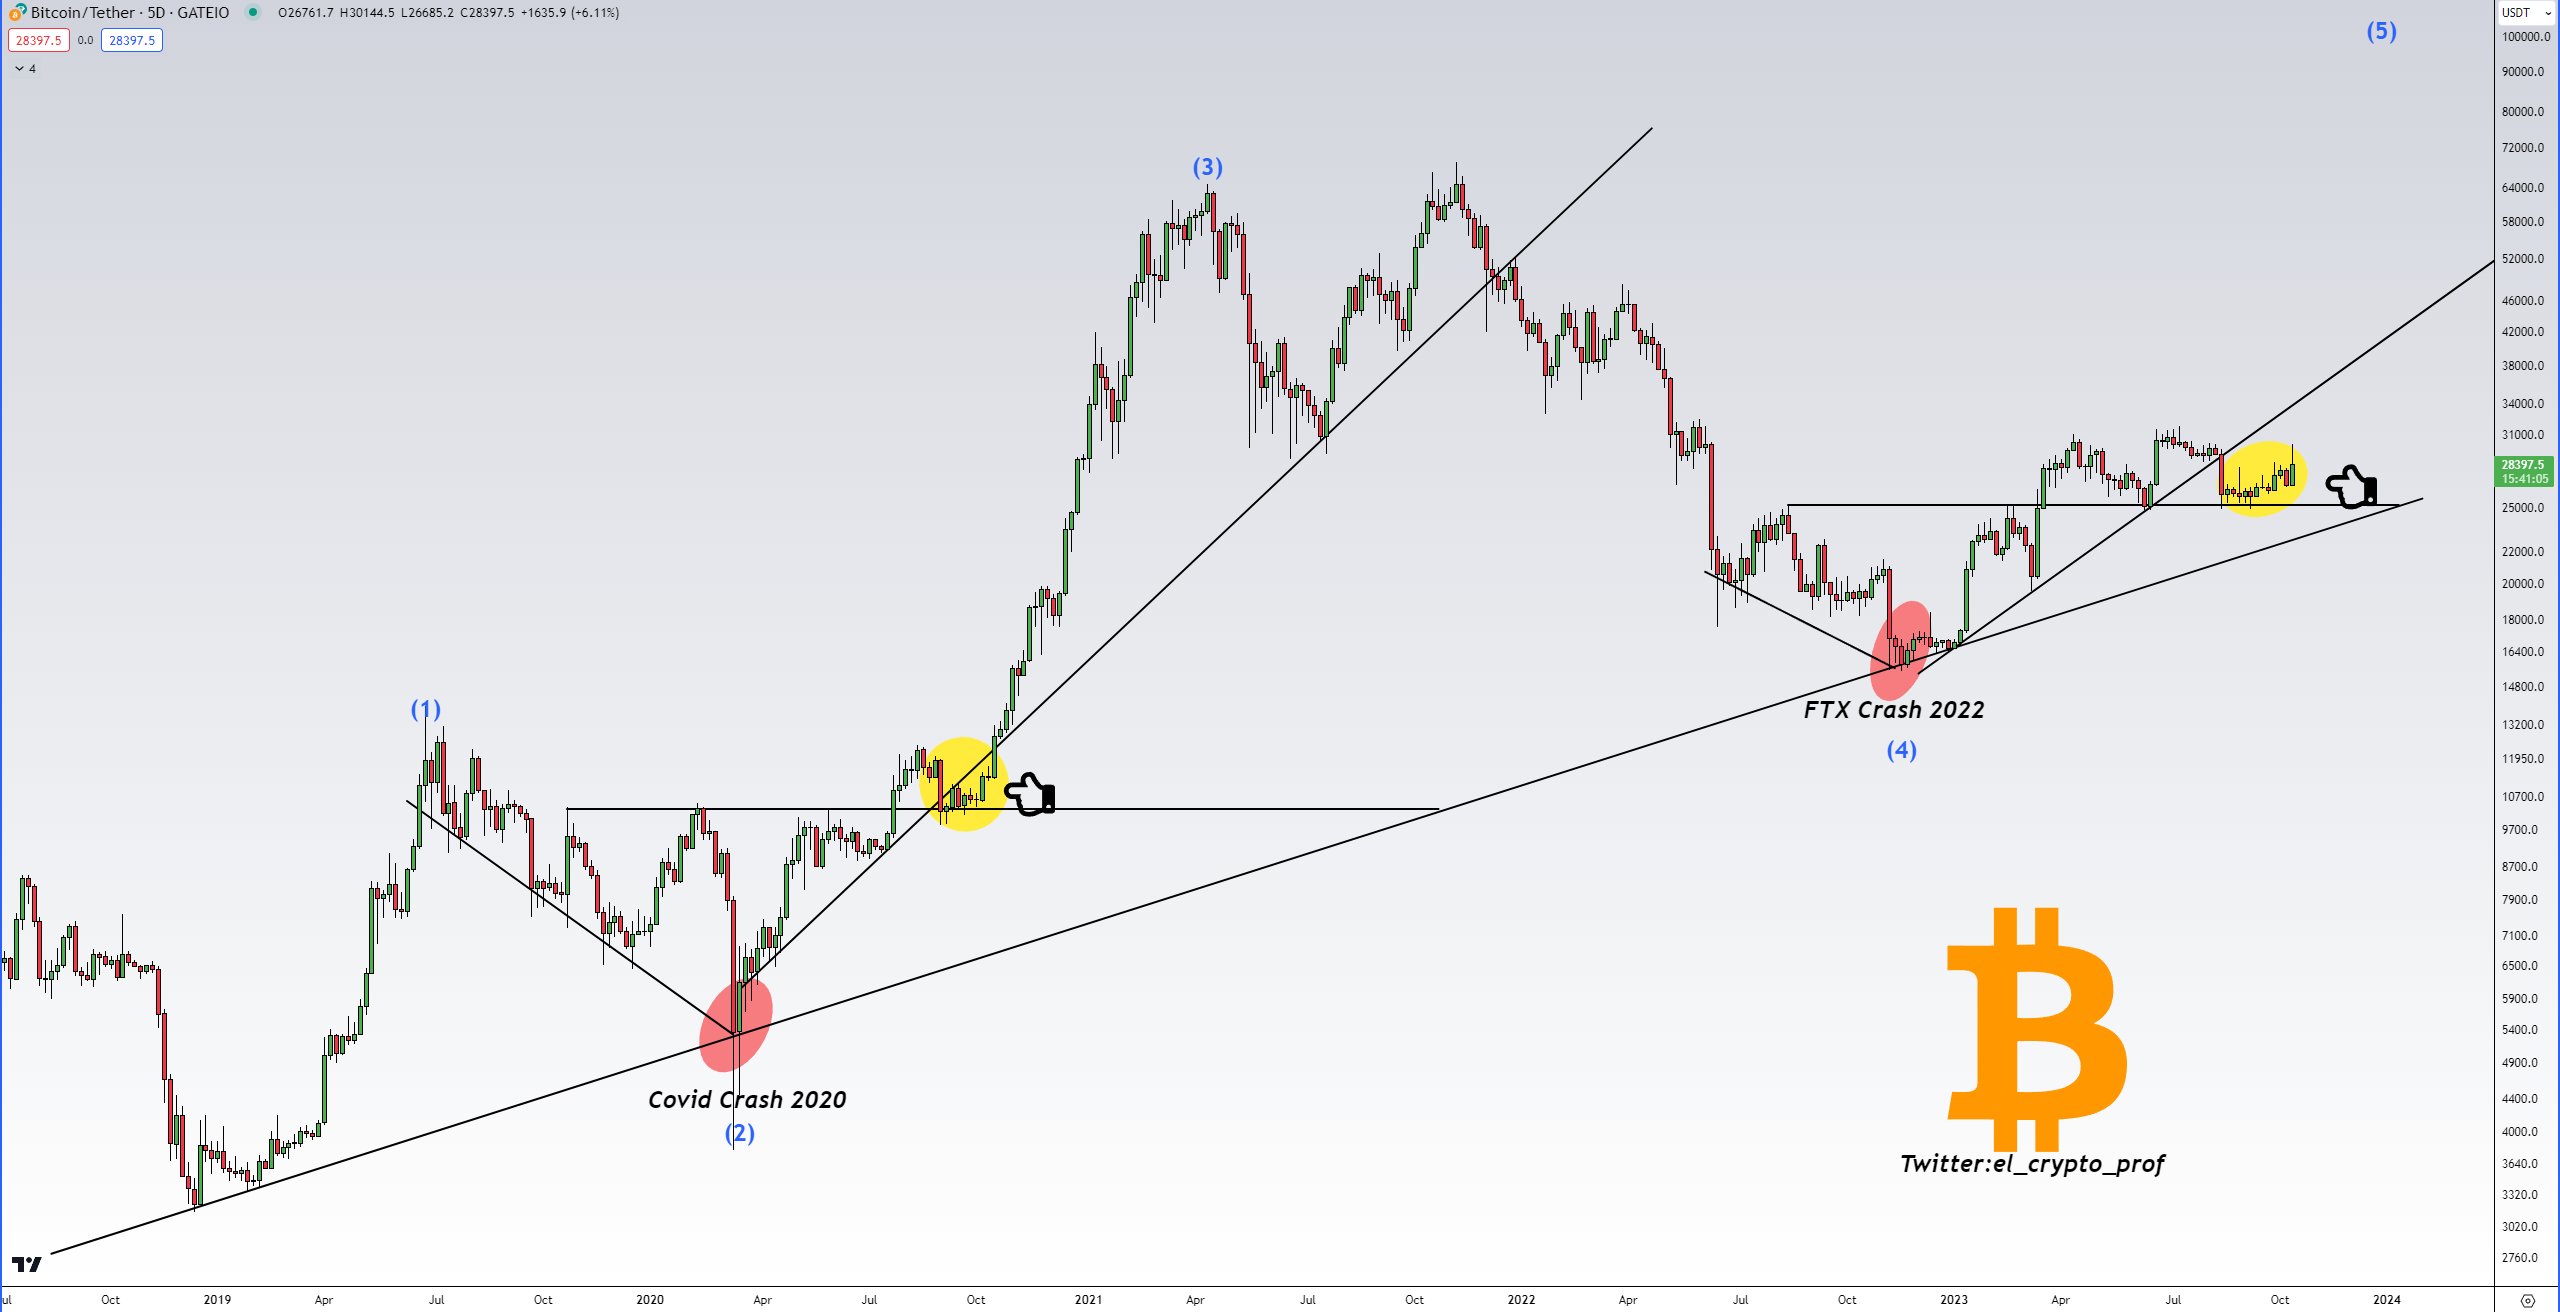
In recent weeks, Bitcoin has been focused on the resistance level of $28,000. The breakthrough of this critical resistance level has disappointed many investors who were hoping for an acceleration in the upward trend. However, Caleb Franzen, a senior analyst at Cubic Analytics, made a post on October 17th, drawing attention to two moving average levels in the Bitcoin chart.
Two Important Levels in Bitcoin Weekly Chart
According to TradingView data, the price of Bitcoin has been squeezed between the 200-week simple moving average (SMA) and the 200-week exponential moving average (EMA). As of October 18th, the SMA 200 average is at $28,277 and the EMA 200 average is at $25,744. These levels have been serving as support and resistance in the Bitcoin chart since mid-August.
According to analysts, this situation is an important factor to be considered in weekly timeframes and creates one of the promising scenarios in the BTC/USD pair. In a part of the post, the analyst made the following comment:
“Despite my tendency to be defensive, one of the reasons I remain patient with Bitcoin is its attempt to use the 200-week moving average level as support. The successful holding of the 200-week EMA by the bulls is a great sign.”
Analyst’s Notable Observation for Bitcoin
Despite geopolitical instabilities and US macroeconomic data affecting not only the cryptocurrency market but also all traditional markets, Bitcoin experienced a 6% increase this week. Recently, the increasing volatility in the BTC/USD pair based on market conditions has also drawn attention.
According to on-chain data for Bitcoin, network fundamentals have reached their all-time high. One of the main reasons for this is the upcoming halving event in April 2024. The direction in which the Bitcoin price will break after this event is a matter of curiosity for everyone.
Among the comments on this subject, the most interesting comment came from popular investor and analyst Moustache. The famous analyst’s graph interpretation comparing Bitcoin’s 2023 performance with its 2020 performance was remarkable. Using a graph shared on X, the analyst compared the market crash due to the COVID-19 pandemic in March 2020 with the FTX scandal at the end of 2022, taking into account the lowest levels of the two years.


