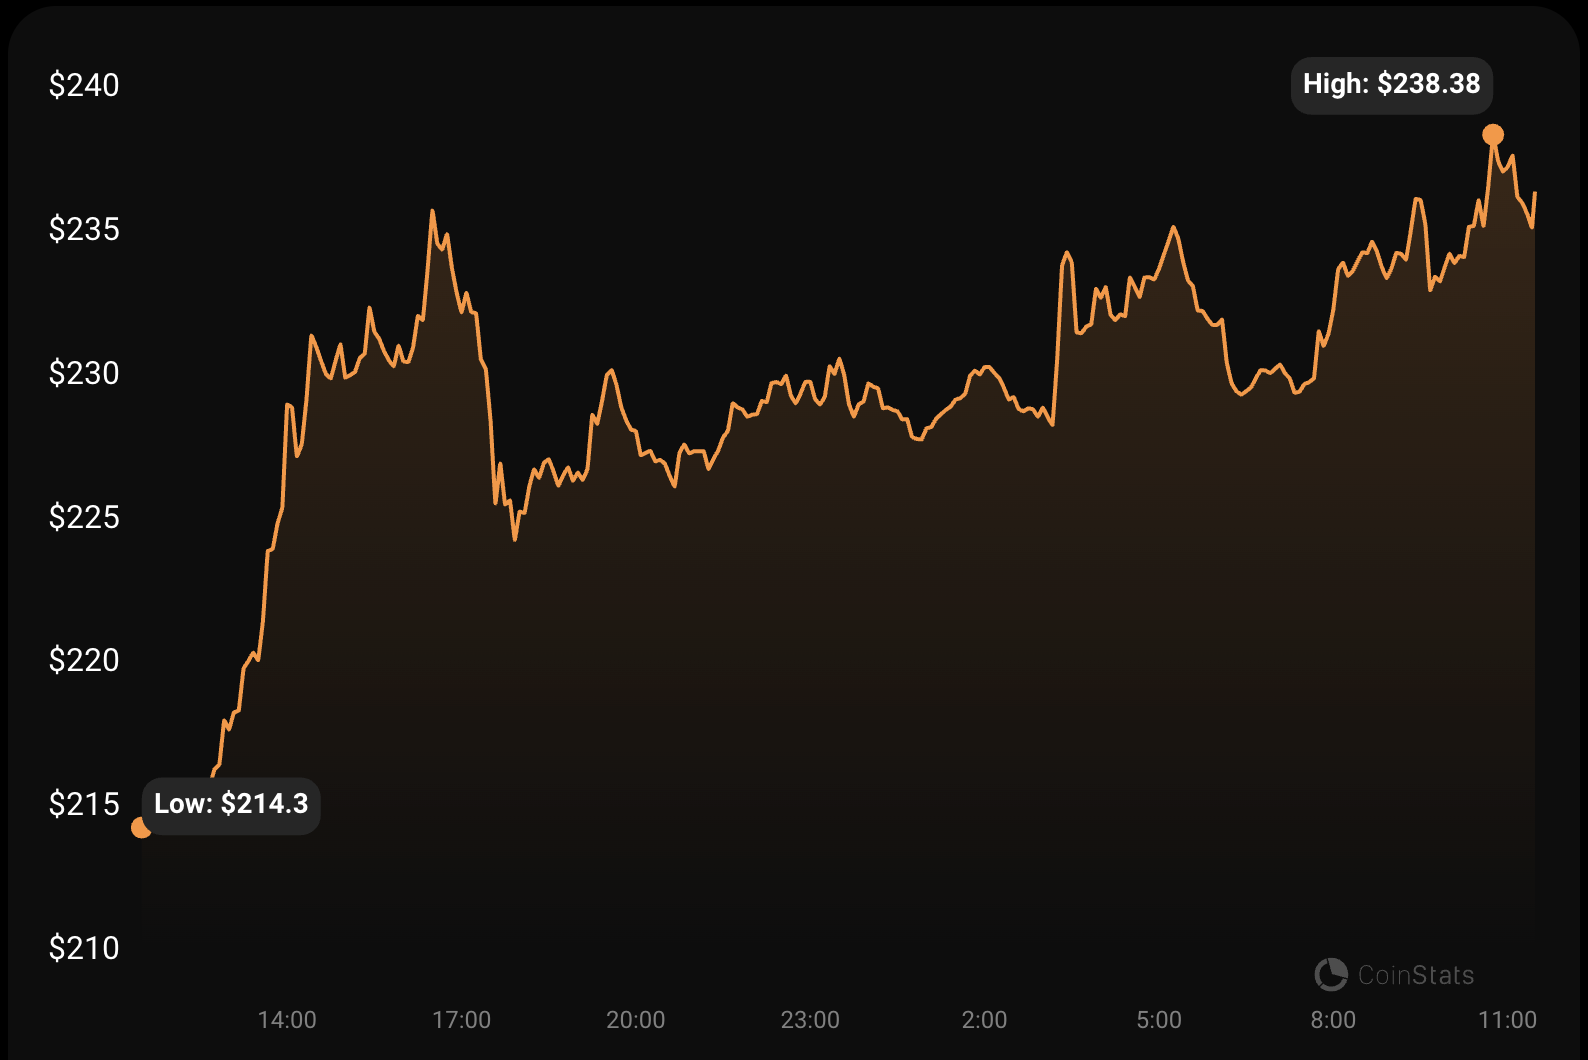
Bitcoin‘s (BTC) first hard fork, Bitcoin Cash (BCH), has seen a surprising 10% increase in price in the past 24 hours. As of the time of writing, Bitcoin Cash has a market cap of $4.63 billion and a trading volume of over $500 million, trading at $237.47. Bitcoin Cash has shown a significant increase of 23% this month, demonstrating a strong performance. Over the past six months, it has shown an impressive increase of 89.67%. Furthermore, BCH has experienced a positive return of 136.09% since the beginning of the year. Let’s take a closer look at what’s next for Bitcoin Cash.
Whales Persistently Accumulate BCH
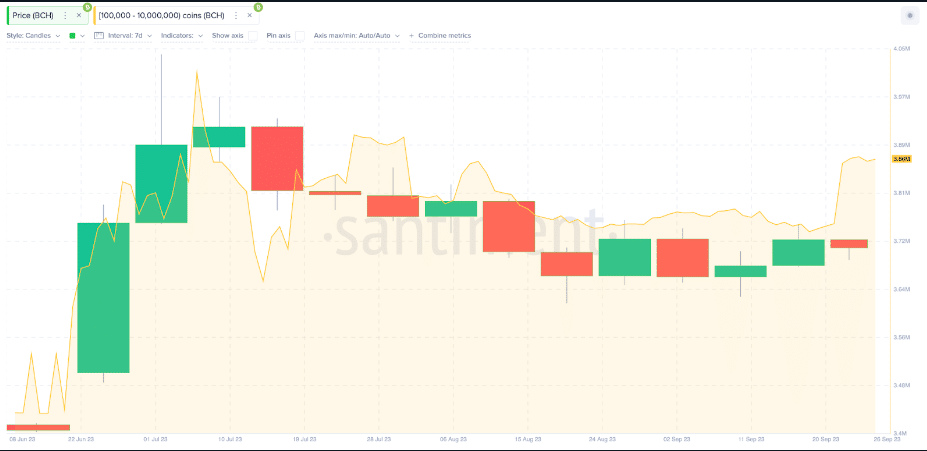
An analysis of whale wallets shared by on-chain data provider Santiment indicates that whales are accumulating large amounts of Bitcoin Cash. Data shows that crypto whales holding between 100,000 and 10 million BCH collectively held 3.74 million BCH on September 18. Furthermore, the amount of BTC held by these whales increased to 3.86 million BCH by September 26.
This indicates that Bitcoin Cash whales have increased their holdings by an additional 120,000 BCH, bringing them to levels seen in July. The 120,000 BCH purchased recently by Bitcoin Cash whales at a price of $213 per BCH is equivalent to approximately $25.6 million.

Past patterns have shown that whale purchases have a significant impact on the price of BCH. As a result, it suggests that these long-term investors continuing to hold their assets will cause the price of BCH to rise further in the coming weeks.

Technical Outlook for Bitcoin Cash
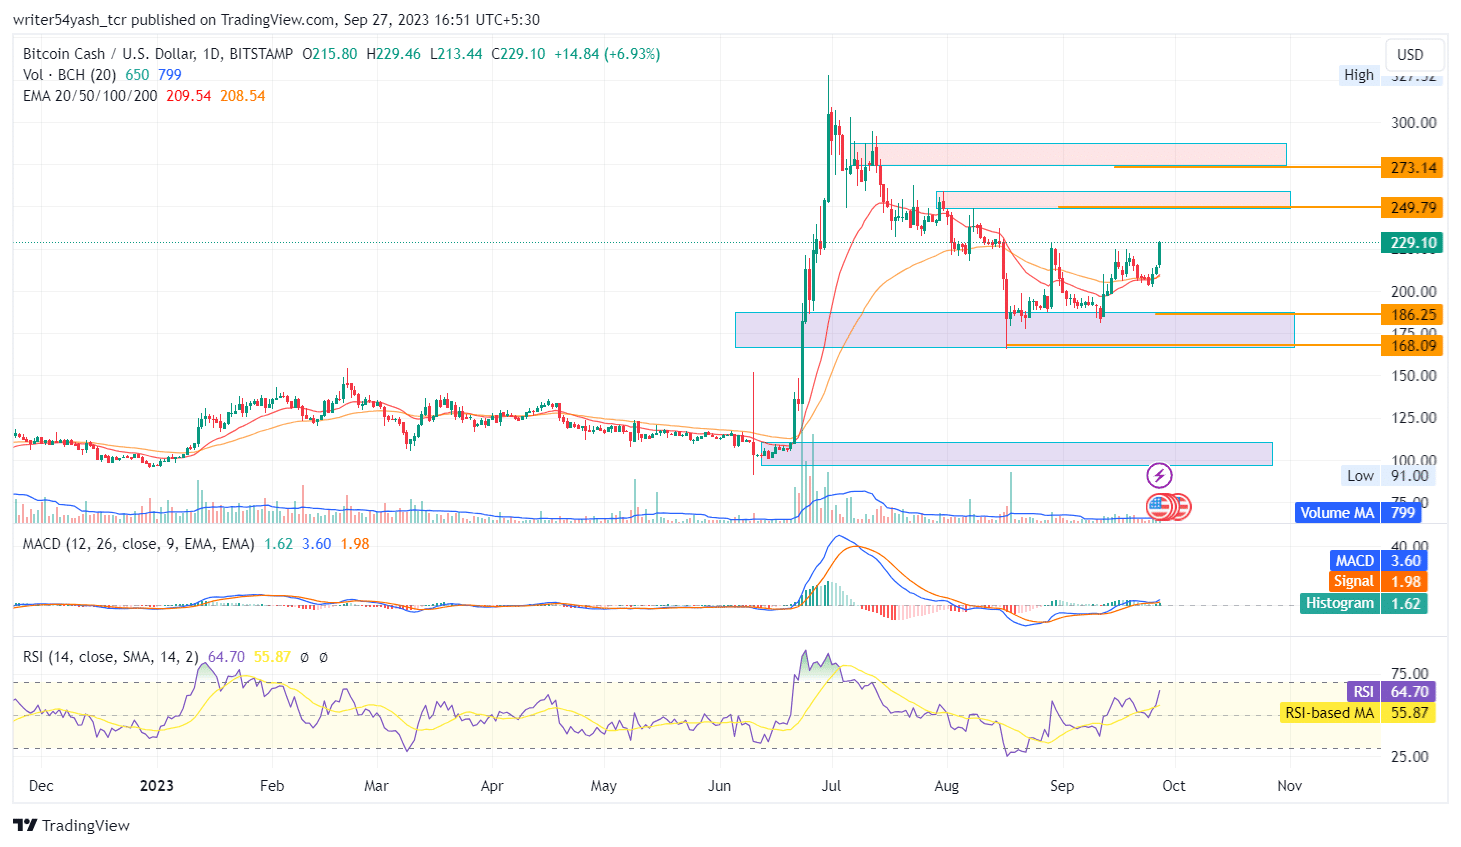
The price of BCH has remained in a consistent downtrend over the past three months, experiencing a 41% decrease during this period. This decline has caused the price to drop from $309 to $183.
Currently, BCH is trading at the aforementioned $237.47 and finding support within a demand zone. If BCH maintains its current level and makes an upward move, the nearest resistance levels to watch are $249.79 and $273.14. However, if BCH fails to hold its current position, the price decline may continue, potentially reaching the nearest support levels at $186.25 and $168.09.

BCH is currently trading above both the 20-day and 50-day exponential moving averages (EMA), providing significant support to the dominant trend in the price chart. In terms of technical indicators, the MACD line is at 3.63 and crossing above the signal line at 1.98. Moreover, both lines are currently above the zero line.
Additionally, the Relative Strength Index (RSI) is currently at 64.84, and the 14-day Simple Moving Average (SMA) is positioned above the midpoint at 52. All of these indicators suggest a potential increase in the price of Bitcoin Cash in the upcoming trading sessions.

 Türkçe
 Español


