
 Türkçe
 Español


Bitcoin’s positive start to the week and its rise to $70,000 was followed by a rapid drop to $66,700 on Monday, causing a market pullback. BTC’s price has been suppressing the recovery on the altcoin side since last week, doing so with its intense supply at the $70,000 level. Amid the market decline, Pepe coin is trading at $0,0000116 after a 3.35% drop in the last 24 hours, delaying the completion of the inverse head and shoulders pattern.
Future of PEPE Coin
The volatile price movements in the market have not significantly impacted PEPE. Over the past two weeks, PEPE’s price movements have been more stable, as reflected in the charts. The daily charts show many closely spaced green and red candles, reflecting the uncertainty and apprehension among both buyers and sellers.
On the other hand, a clearer interpretation suggests that the price consolidation reflects an accumulation trend before the completion of the inverse head and shoulders pattern.
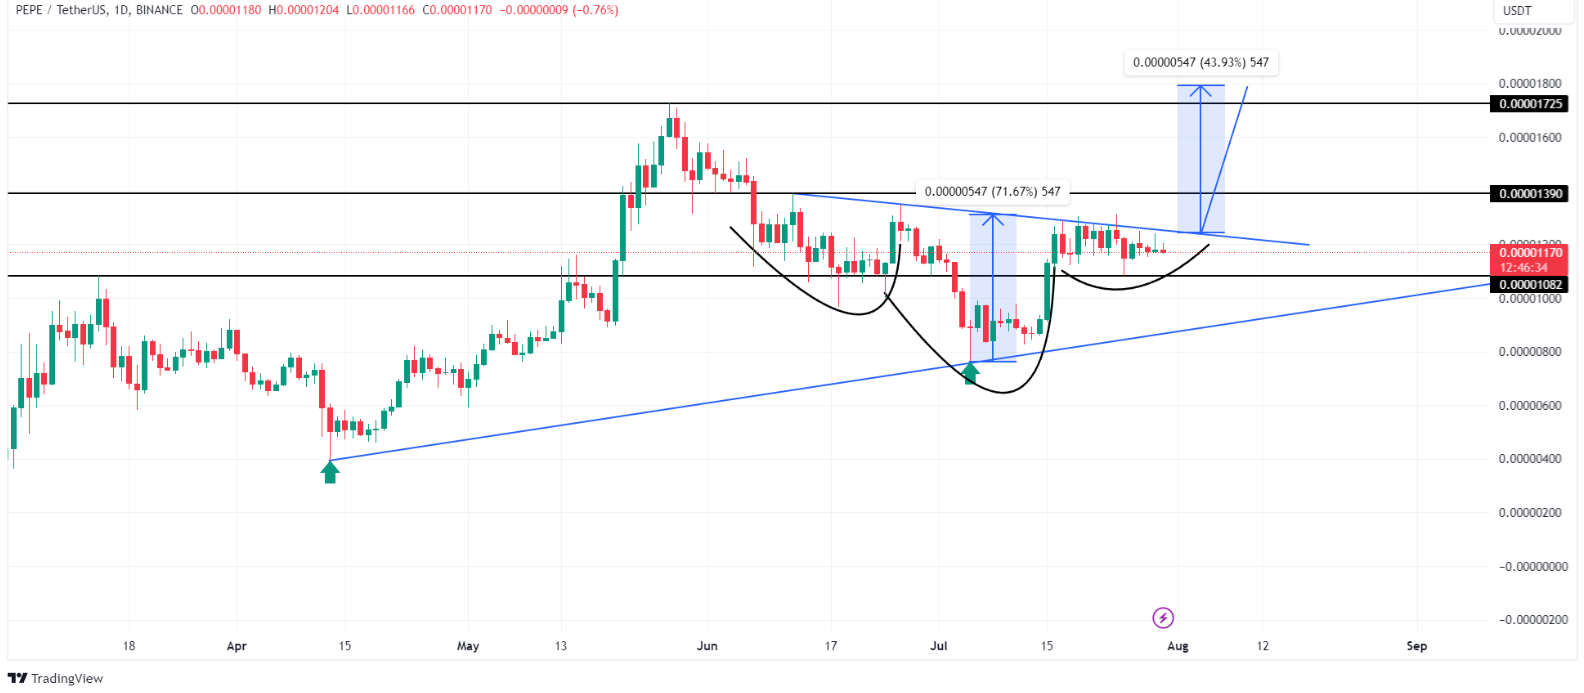
As of the time of writing, PEPE is seen as the 22nd largest cryptocurrency with a market value of $4.83 billion. On the other hand, its price is finding buyers at $0,0000116. A potential breakout at the resistance level on the neckline seen in the chart above could bring buying pressure and a return to an upward trend.
According to the analysis on the chart, a rally that could occur after the breakout could see PEPE reach a new peak at $0,000018 after a 40% rise.
Who Profits from PEPE
Pepe Coin‘s Global In/Out of the Money (GIOM) metric also shows positive data. As of the time of writing, 77% of the addresses transacting in PEPE coin are ‘in the money’ (i.e., profitable). Additionally, only 11% are ‘out of the money’ (i.e., at a loss). Considering this, it is seen that investors have the ability to move comfortably.

Finally, the chart shows that 35,230 addresses that purchased 56.5 trillion PEPE between $0,0000110 and $0,0000130 are at breakeven. A breakout seen in the chart above could allow these breakeven addresses to turn profitable. On the other hand, the small red indicators on the GIOM chart point to the resistance levels between PEPE and its ATH.


