Bitcoin ETF funds’ relentless hunger is greatly surpassing the new Bitcoin supply anticipated for the year 2024. Compared to the approximately 65,500 Bitcoins mined in 2024, the two largest Bitcoin ETF funds are holding more than 330,000 Bitcoins. It is likely that strong demand will limit any downward trends in the near term. Bernstein analysts forecast that Bitcoin could reach $150,000 by the middle of 2025.
Bitcoin Chart Analysis
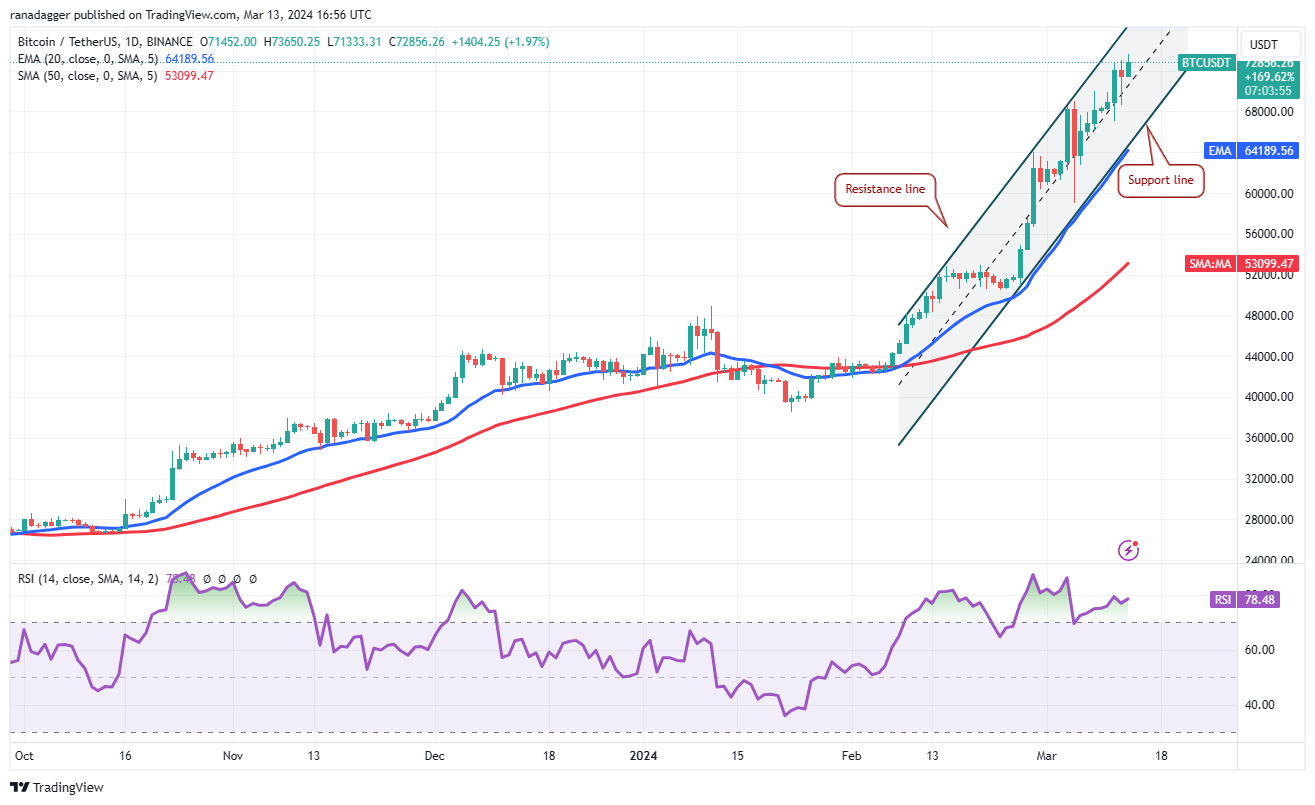
Bears attempted to initiate a pullback from $73,000, but the long tail on Bitcoin’s March 12 candlestick indicates solid buying during intraday dips. The BTC/USDT pair has been climbing in the upper half of an ascending channel formation for several days, yet bears have prevented the price from breaking above the resistance line. However, if bulls manage to push the price above the channel, the upward momentum could increase, potentially raising the pair to $80,000.

Contrary to this assumption, if the price falls and dips below $70,000, the pair could drop to the channel’s support line. If bears pull the price below the channel, selling could accelerate. The pair could fall to $59,000 and then to the 50-day simple moving average at $53,099.
Ethereum Chart Analysis
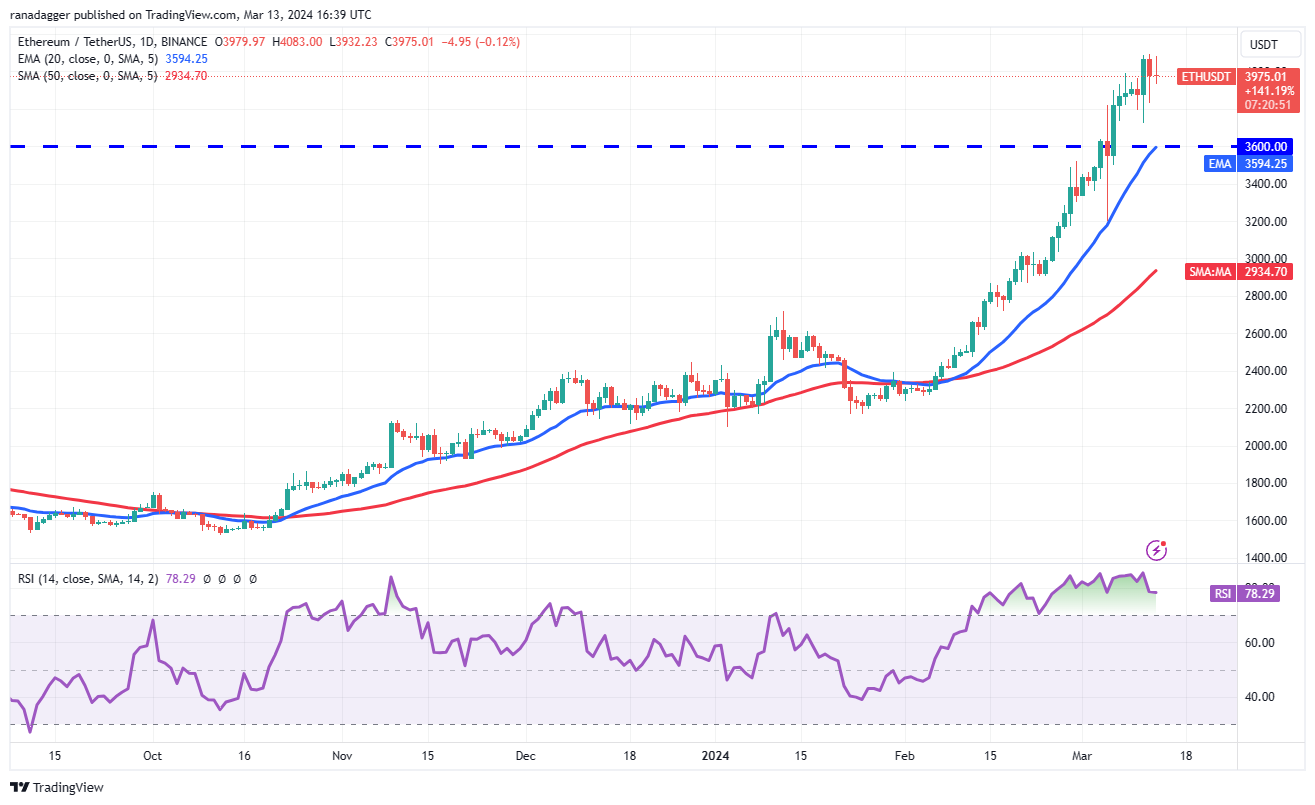
Bears pulled Ethereum below the $4,000 psychological level on March 12th, but the long tail on the day’s candlestick suggests that each dip is seen as a buying opportunity. Buyers are trying to lift the price above the immediate resistance at $4,100. If successful, the ETH/USDT pair could initiate the next leg of its uptrend, potentially rising to $4,372 and ultimately to $4,868.

A minor risk to the rally’s continuation is the RSI trading in the overbought region for the past few days. This indicates the rally might be overheated, suggesting a possible minor correction or consolidation. The critical support to watch on the downside is at the $3,600 level.
BNB Chart Analysis
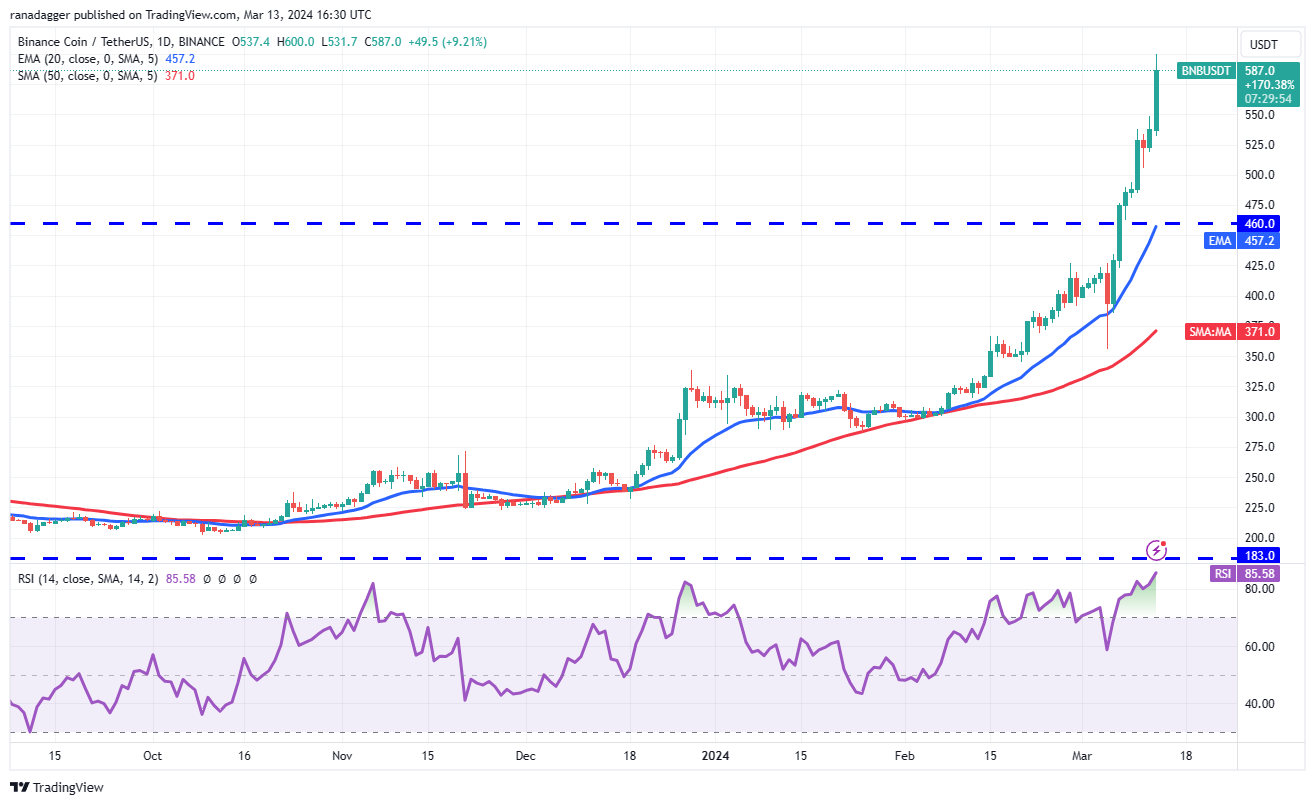
BNB gained momentum after breaking above $460 and has been on an uptrend since. This indicates strong demand at higher levels. A minor resistance is at $617, but if buyers keep the upper hand, the uptrend is expected to continue, with the BNB/USDT pair possibly rising to $670.

Vertical rallies are rarely sustainable and often followed by sharp declines. The first sign of weakness could be a drop below the psychological level of $500. This could accelerate selling, potentially driving the pair down to $460.


