COINTURK NEWSCOINTURK NEWSCOINTURK NEWS
  • Crypto Tracker App
  • Bitcoin
  • Altcoin
  • Ethereum
  • Advertise
  • Contact
  • TURTURTUR
  • ESESES
Search
© 2024 COINTURK NEWS. All Rights Reserved.
Reading: Bitcoin Faces a Significant Retreat: Is the Bull Run Over?
Share
Font ResizerAa
COINTURK NEWSCOINTURK NEWS
Font ResizerAa
Search
  • Crypto Tracker App
  • Bitcoin
  • Altcoin
  • Ethereum
  • Advertise
  • Contact
  • TURTURTUR
  • ESESES
Follow US
© 2025 >> COINTURK NEWS
Powered by LK SOFTWARE
COINTURK NEWS > Bitcoin (BTC) > Bitcoin Faces a Significant Retreat: Is the Bull Run Over?
Bitcoin (BTC)

Bitcoin Faces a Significant Retreat: Is the Bull Run Over?

In Brief

  • Bitcoin recently experienced a 15% drop from its peak.

  • Investors analyze charts for Bitcoin's next move after the decline.

  • Technical indicators like Parabolic SAR suggest a resilient uptrend.

COINTURK NEWS
COINTURK NEWS 2 years ago
Share
SHARE

Recently, Bitcoin has witnessed a significant retreat, experiencing a 15% drop from its 2024 high of $49,000. This unexpected downturn has sparked debates and analyses within the crypto community following the approval of 11 spot Bitcoin Exchange Traded Funds (ETFs). Investors are now examining the charts for indicators of Bitcoin’s next move.

Contents
Has Bitcoin’s Uptrend Ended?A Glimmer of Optimism for BitcoinUnderstanding the Parabolic SAR

Has Bitcoin’s Uptrend Ended?

The sudden correction necessitates a closer examination through the lens of technical analysis. Notably, the decline included a bearish candle on the daily chart, signaling a potential reversal in Bitcoin’s upward trajectory. Adding to the complexity, there was a significant wick depicting a major sell-off following the peak in prices.

CME BTC Futures’ emergence with a notable downward gap further complicates matters. Such gaps often act as potential resistance levels and reinforce the prevailing bearish trend.

A Glimmer of Optimism for Bitcoin

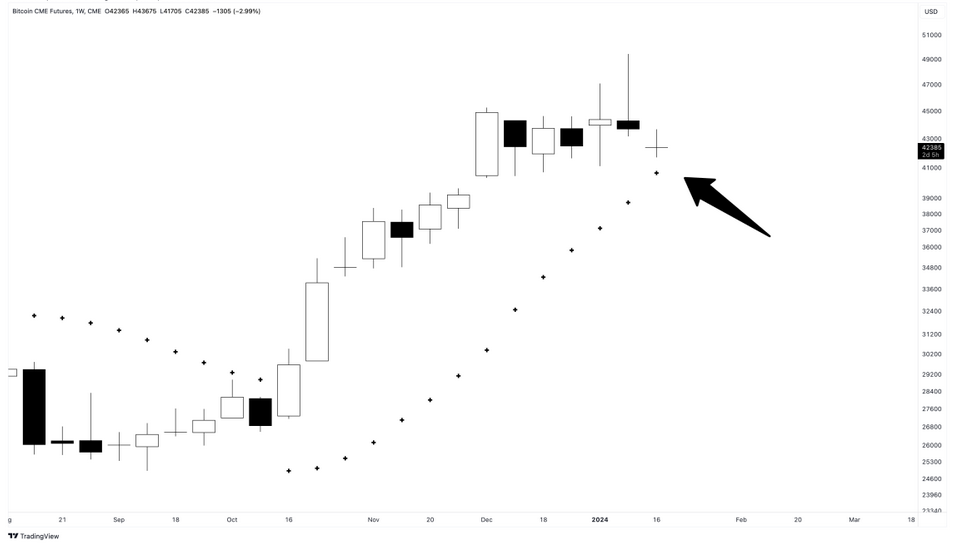
Amidst the prevailing negative signals, a glimmer of optimism emerges from an important technical indicator, the Parabolic SAR. Despite market turmoil, the untouched weekly BTCUSD Parabolic SAR indicator points to the resilience of the long-term bullish trend.

This indicator, known for its effectiveness in identifying potential reversals, provides a contrasting perspective amidst instant bearish signals and sentiment.

Understanding the Parabolic SAR

In this context, it’s important to understand the significance of the Parabolic SAR by grasping its functionality. As an effective technical analysis tool, the Parabolic SAR primarily determines the direction of an asset’s momentum and offers insights on entry and exit points.

The ‘SAR’ in Parabolic SAR stands for ‘Stop and Reverse’. It is represented on charts as a series of dots above or below price bars, with a dot below indicating bullish momentum and a dot above signaling a bearish trend.

A distinctive feature of the Parabolic SAR is its role as a trailing stop-loss. As the price of the asset fluctuates, the Parabolic SAR is dynamically adjusted and approaches the price line. This dynamic adjustment allows investors to effectively manage their positions, securing profits while minimizing potential losses.

In the current context of Bitcoin’s market dynamics, the position of the Parabolic SAR, still below the weekly chart’s price bars, indicates that the long-term bullish trend continues uninterrupted.

You can follow our news on X, Telegram, Facebook & Coinmarketcap
Disclaimer: The information contained in this article does not constitute investment advice. Investors should be aware that cryptocurrencies carry high volatility and therefore risk, and should conduct their own research.

You Might Also Like

BIP 110 support drops below 10 percent and canceled! What does this mean for Bitcoin’s future?

FARTCOIN trades at $0.1635 as analysts say Bitcoin’s direction could push price to $0.22 or even $0.50

Analysts highlight rare bullish signals in Bitcoin, $65,400 target emerges

Spot Bitcoin ETFs saw $221 million inflow on June 2, ending 10-day outflow streak

John Bollinger highlighted a potential reversal in Bitcoin with a W formation as ETF inflows support the $60,000 zone

COINTURK NEWS 18 January, 2024 - 2:05 am 18 January, 2024 - 2:05 am
Share This Article
Facebook Twitter
Share
Previous Article Wormhole Protocol’s TVL Surpasses $1 Billion After Two Years
Next Article Record-Breaking Volume in Bitcoin ETFs: Impact on Bitcoin Price?
Leave a comment

Leave a Reply Cancel reply

Your email address will not be published. Required fields are marked *

This site uses Akismet to reduce spam. Learn how your comment data is processed.

Stay Connected

8.1k Like
21.1k Follow
1.1k Follow

Latest News

Shiba Inu failed to hold above $0.000005 as selling pressure increased near key resistance
Shiba (SHIB)
Ethereum booms 4.7 percent in a single session! What critical thresholds are traders watching?
Ethereum (ETH)
Travala announced XRP can be used for over 2.2 million hotel bookings worldwide
Ripple (XRP)
//

COINTURK was launched in March 2014 by a group of technology enthusiasts who believe that Bitcoin will be as important as the internet in the world of the future thanks to the amazing technology underlying it.

CRYPTOCURRENCY LIVE PRICES

  • Bitcoin (BTC) Live Price
  • Ethereum (ETH) Live Price
  • Ripple (XRP) Live Price
  • Solana (SOL) Live Price
  • Dogecoin (DOGE) Live Price
  • Cardano (ADA) Live Price
  • Chainlink (LINK) Live Price

OUR PARTNERS

  • COINMARKETCAP
  • COINGECKO
  • BITCOINHABER
  • BH NEWS
  • 21MILYON
  • NEWSLINKER

OUR COMPANY

  • About Us
  • Cookie Policy
  • Advertising
  • Contact
COINTURK NEWSCOINTURK NEWS
Follow US
COINTURK NEWS 2026
Powered by LK SOFTWARE
Welcome Back!

Sign in to your account

Lost your password?