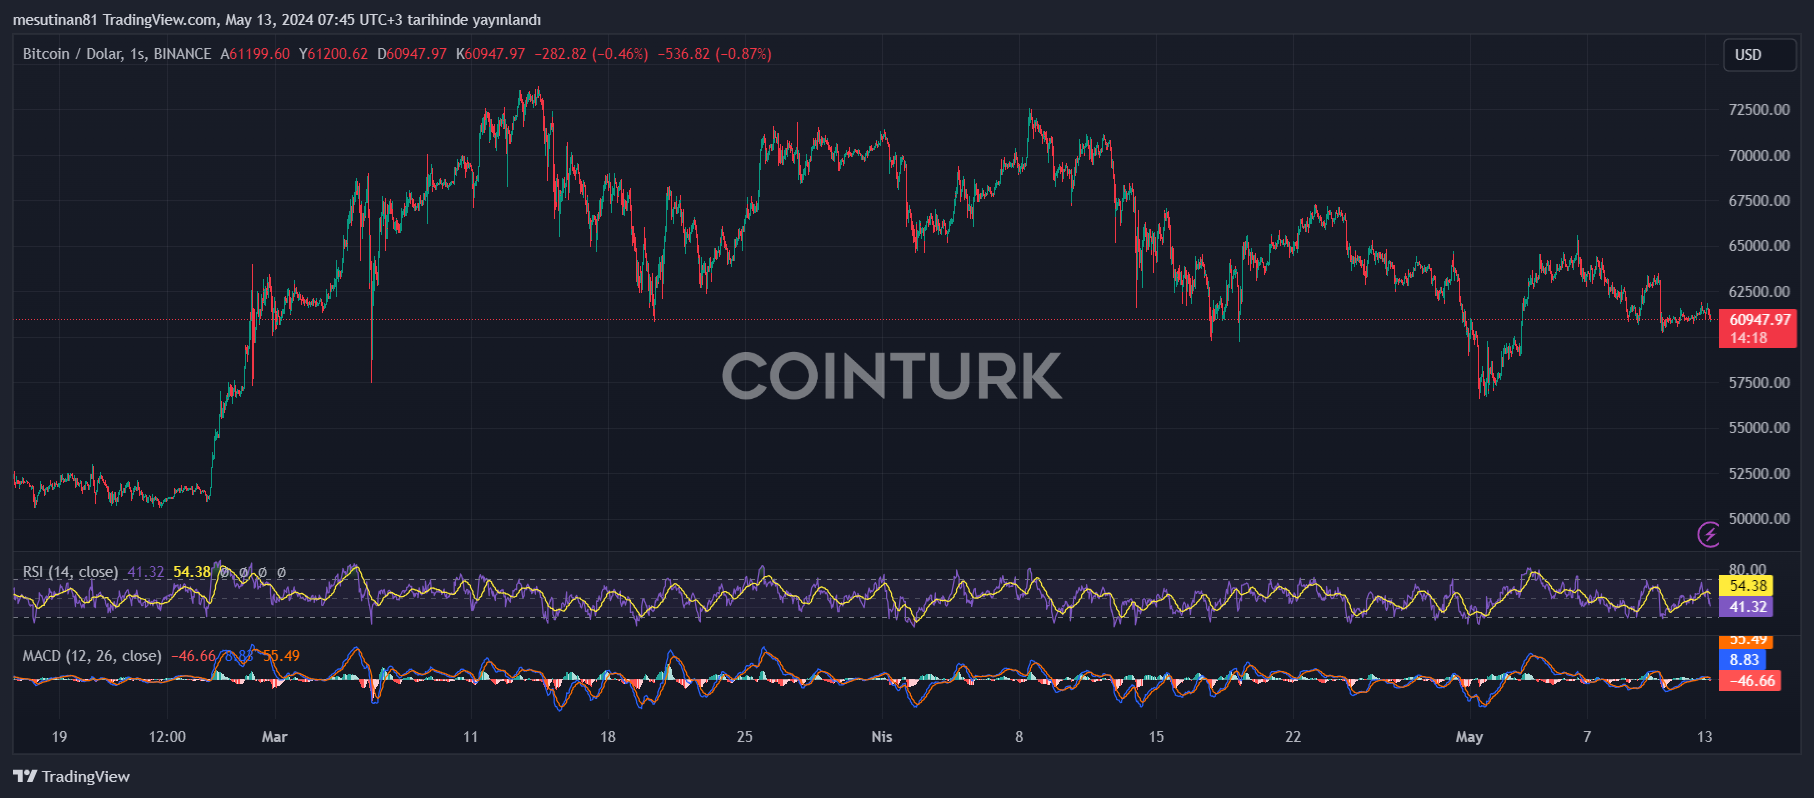
Bitcoin price started a new decline from the $62,000 resistance zone and is now under the risk of further losses below the $60,000 level. While the cryptocurrency markets have been volatile recently, several factors increasing pressure on the BTC/USD pair should be considered. As investors, which levels should we watch?
Investor Pressure in Bitcoin
Firstly, Bitcoin’s failed attempts around the $62,000 level have increased selling pressure from investors. The price is trading below $61,000 and the 100-hour simple moving average, showing signs of weakness in the short-term outlook.
In particular, a breakdown below the bear flag formation around $60,950 on the hourly chart of the BTC/USD pair indicates that the downtrend may continue, and a close below the $60,000 level could lead to further downward momentum.
Challenges Ahead for BTC Price
In technical analysis, the distribution of Bitcoin price signals is also of critical importance. After finding support near the $60,250 region, the price initiated a recovery wave. However, these recovery efforts were limited by bears active near the $61,800 resistance area.

Currently, the BTC/USD pair is at the $61,000 level. Although immediate resistance is near $61,200, there are significant barriers ahead. $62,000 is set as the first major resistance level. Beyond that, critical resistance areas like $62,500 and $63,500 could limit any price increases.
Which Levels Could a Downward Move Bring into Focus?
The cryptocurrency Bitcoin (BTC) has recently failed to overcome the $61,200 resistance area, increasing concerns that the currency could face a downward move. Currently, the most important observation is BTC’s urgent search for support towards the $60,500 level.
Currently, a break below critical support levels could pull the price further down. The first major support is at the $60,000 level. If a close below this level occurs, a scenario where BTC could drop to $58,500 could come into play. In this case, with increasing losses, the price could soon retreat to the $56,650 support area.
Looking at technical indicators, the hourly MACD indicator is currently gaining momentum in the bearish zone. Similarly, the hourly RSI (Relative Strength Index) value is also below 50 for BTC/USD, indicating that the market is currently balanced in favor of the bears.

 Türkçe
 Español


