Bitcoin could not maintain its recovery last week, indicating that bears are not giving up and are using rallies as selling opportunities. The closer the price stays to $60,000, the higher the likelihood of a downward breakout. However, analysts continue to be bullish about the price movement in the post-halving cycle. According to Timothy Peterson, founder and investment manager at Cane Island Alternative Advisors, Bitcoin could rise to anywhere between $175,000 and $350,000 in the next 9 months.
Bitcoin Daily Chart Analysis
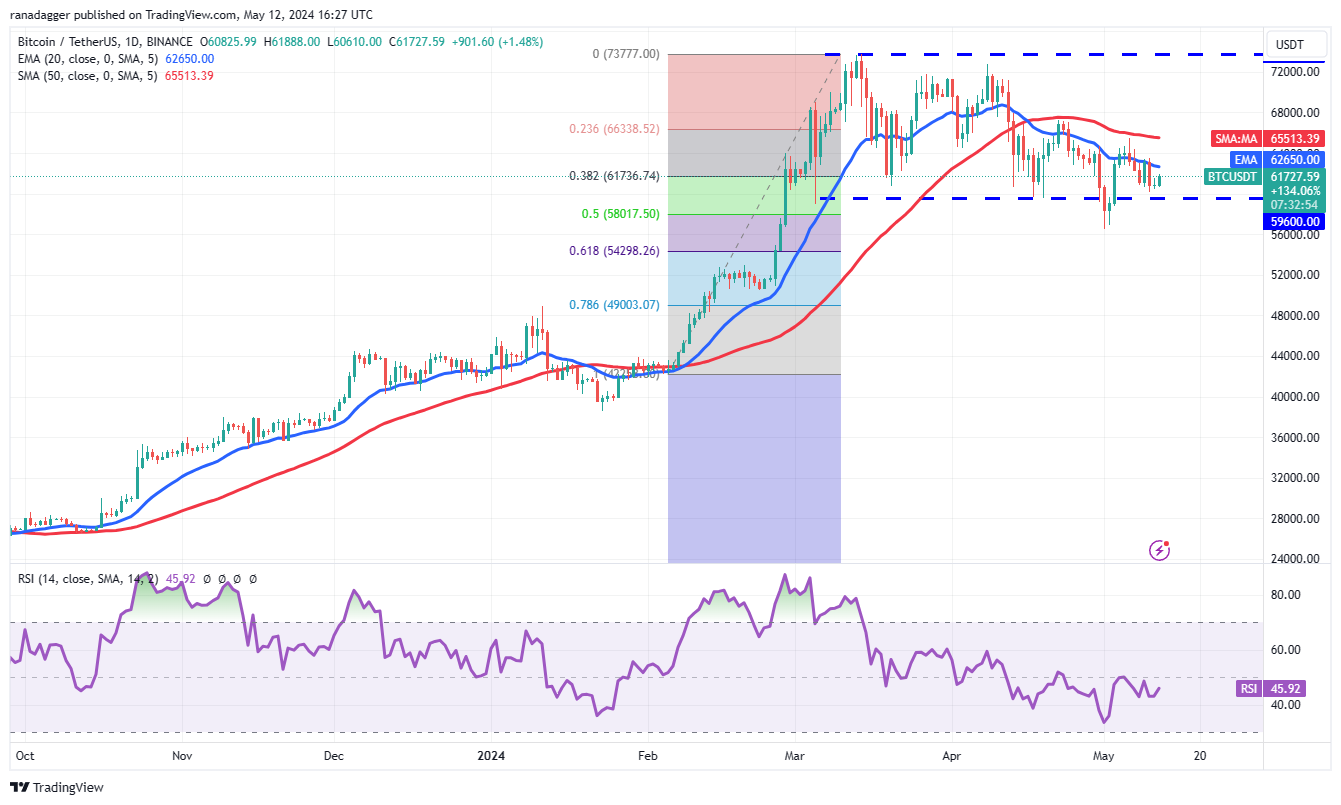
Bulls successfully defended the $59,600 level in Bitcoin but failed to push the price above the 20-day exponential moving average at $62,650. This shows the intense struggle between bulls and bears.

The daily EMA 20 level and the relative strength index (RSI) in the negative zone indicate an advantage for sellers. If the $59,600 level is breached, the BTC/USDT pair could retest the intra-day low of May 1 at $56,552. This level is expected to attract buyers, but if bears prevail, the pair could drop to the 61.8% Fibonacci retracement level at $54,298.
Bulls will need to keep the price above the 20-day EMA average to prevent a downward move. If they manage this, the pair could rise to $67,250, and buyers will need to overcome this barrier to initiate a rally towards $73,777.
Bitcoin Chart Analysis
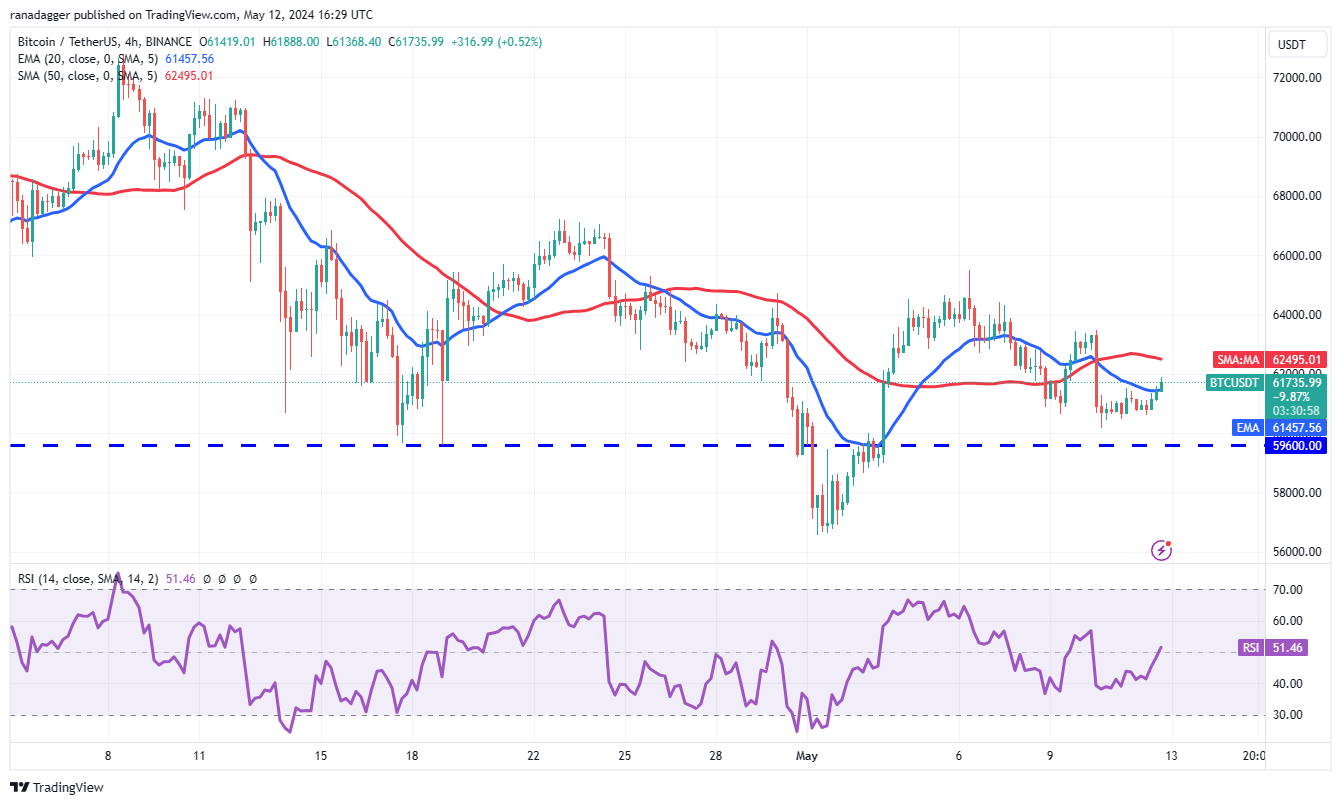
On the 4-hour chart, the EMA 20 average is flattening and the RSI level is near the midpoint, indicating reduced selling pressure. The most important support to watch is the $59,600 level, and breaching this could increase sales and drop the pair to $56,552.
Conversely, if the price rises above the 50-simple moving average, it would signify bulls attempting a comeback. The pair could rise to $63,500 and then to $65,500, and a break above this resistance could signal that bears are losing control. Particularly in the ETF sector or positive developments from the SEC could trigger a price spike for Bitcoin.


 Türkçe
 Español


