Bitcoin‘s price continues to face strong selling pressure after a 7% drop last week, currently at $42,750. Despite strong inflows into spot Bitcoin ETFs last week, BTC’s price did not show an upward trend.
Bitcoin’s Supply in Profit Enters High-Risk Zone, Yet Golden Cross Occurs
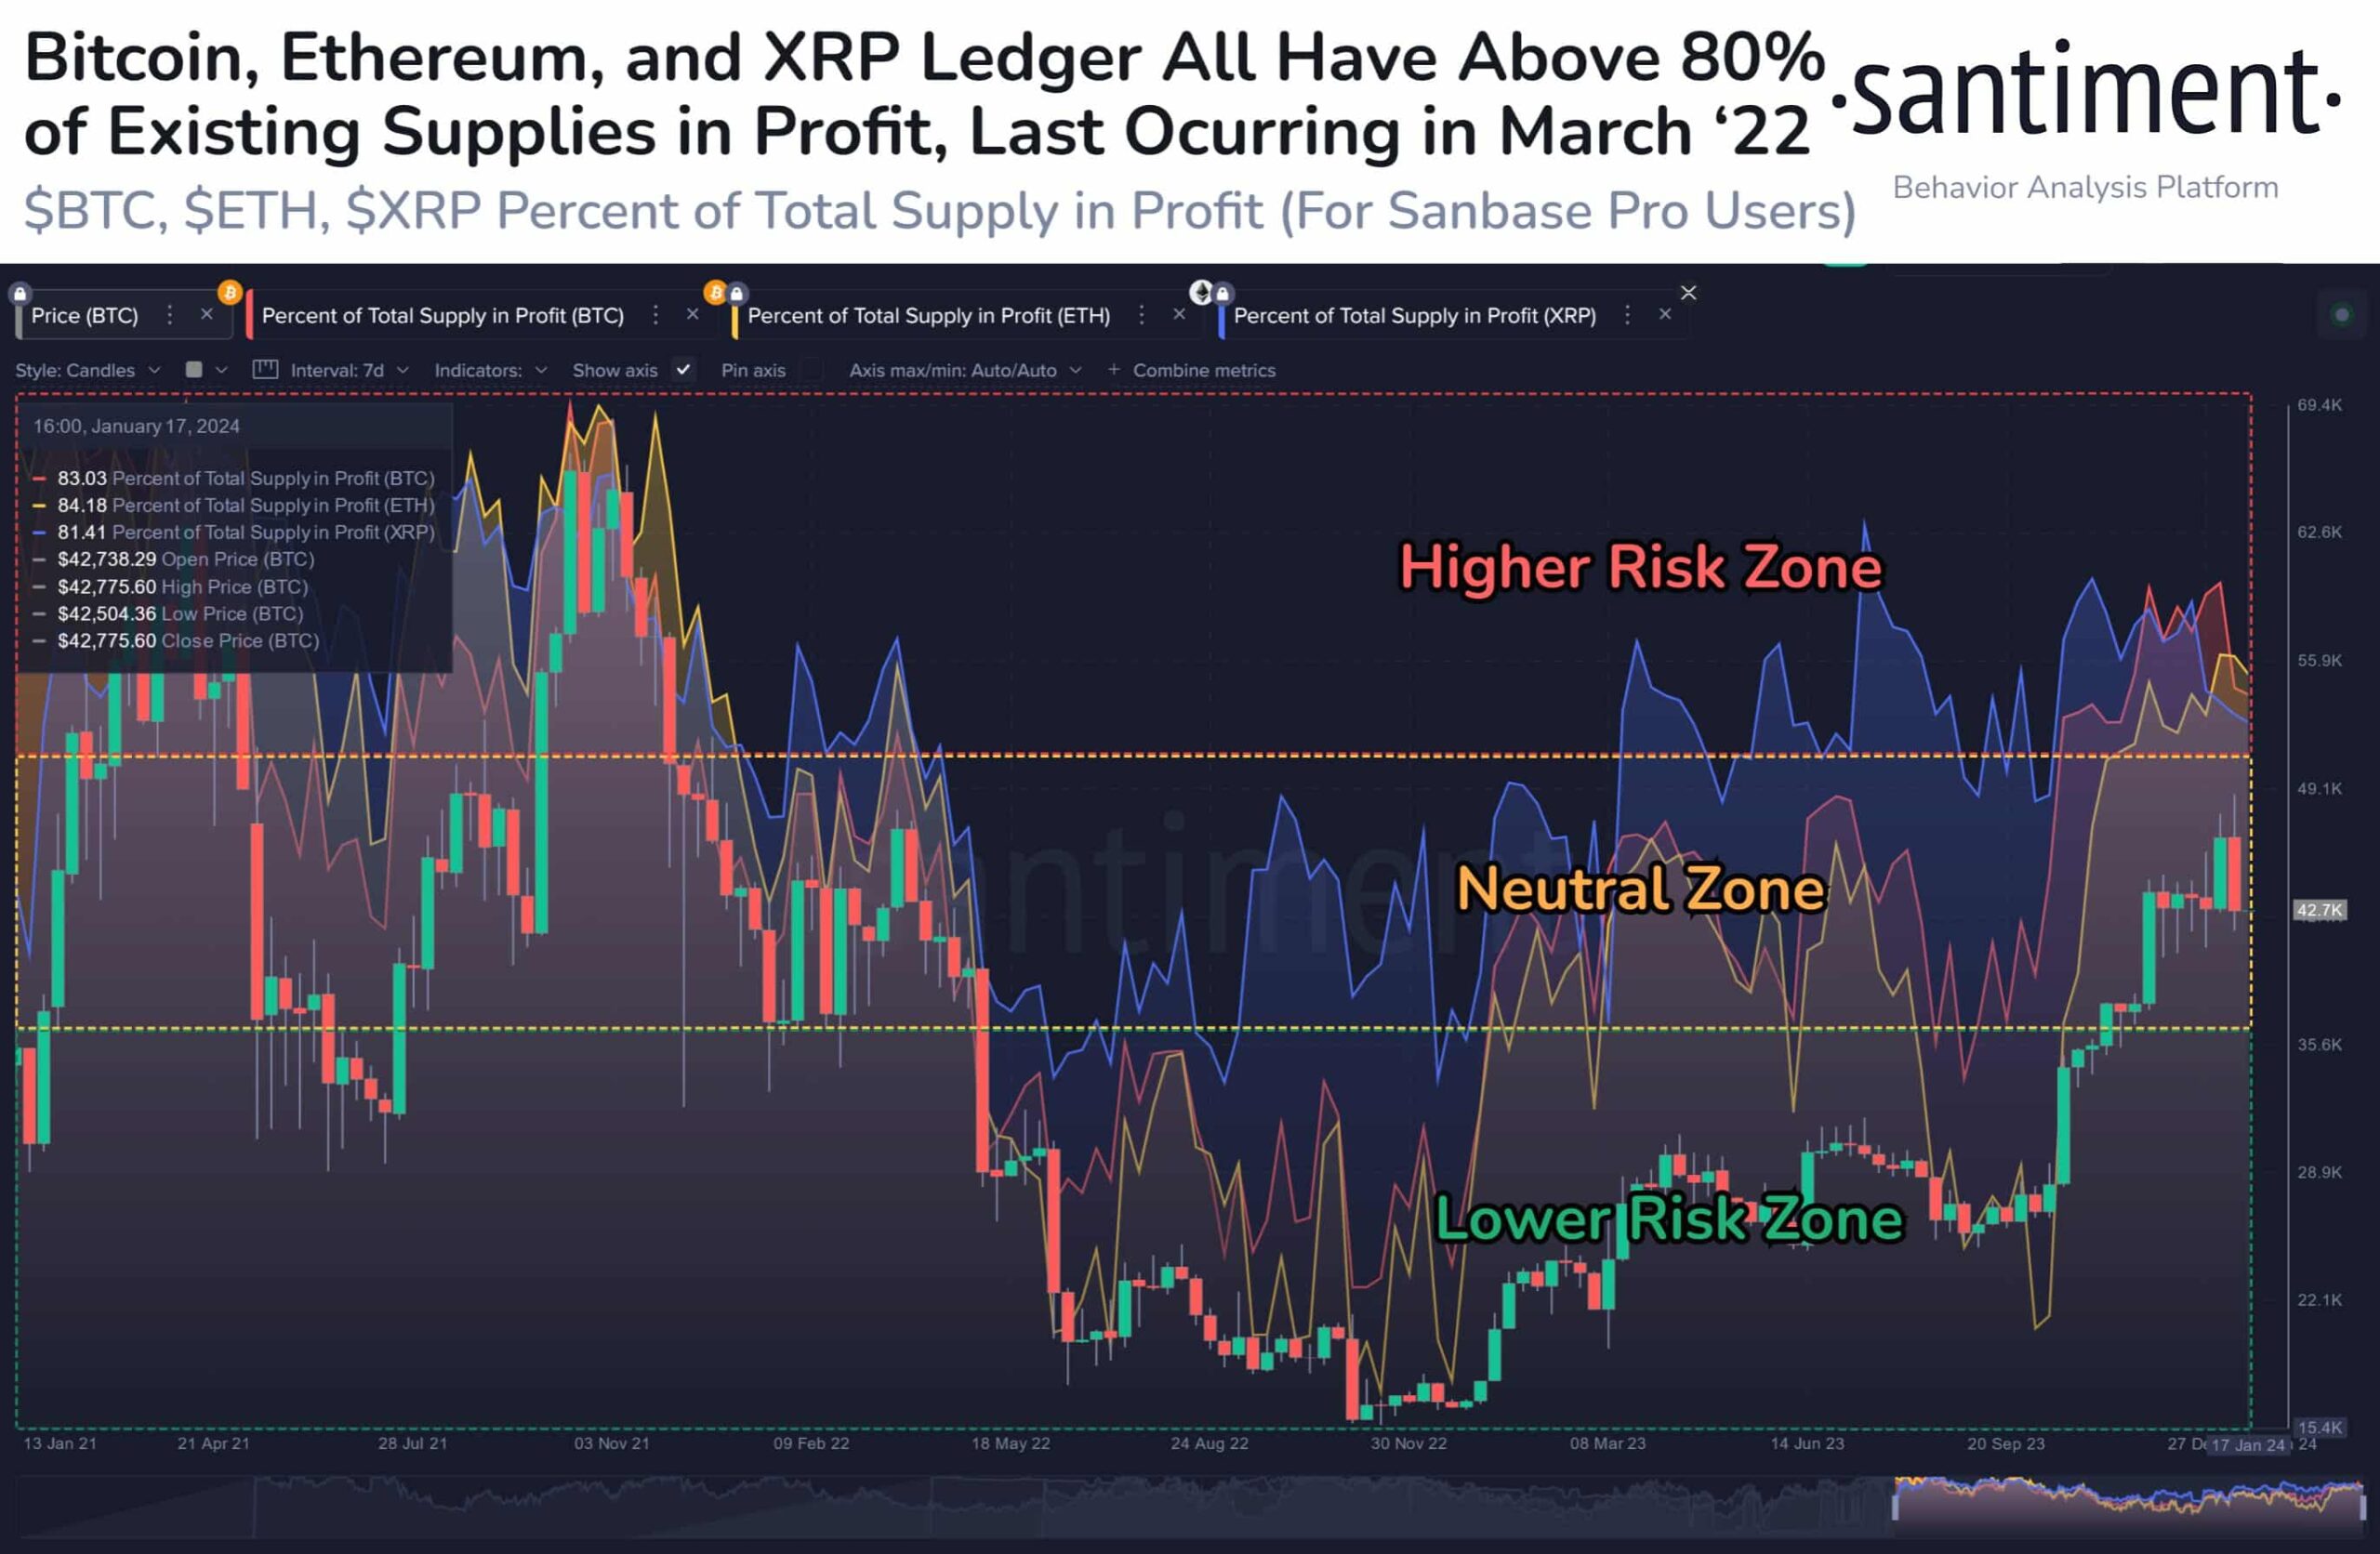
On-chain data provider Santiment reports that Bitcoin (at 83%), along with other altcoins like Ethereum (at 84%) and XRP (at 81%), is currently in a historically high-risk profit zone. These percentages exceed the average range of 55 – 75% that goes back to 2018, which is quite remarkable.

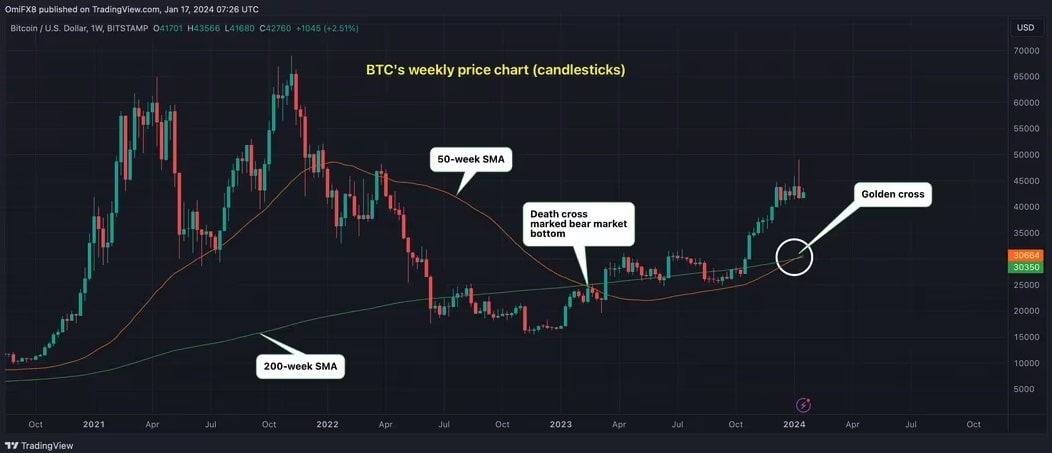
However, Bitcoin’s 50-week Simple Moving Average (SMA) has recently crossed above the 200-week SMA, completing a bullish formation known as the “golden cross.” This event, seen for the first time in a long while on the largest cryptocurrency‘s weekly price chart, is viewed by market enthusiasts as a positive signal for its future.

The potential long-term bull market-indicating golden cross formation is a concept of significant importance in technical analysis, with origins tracing back to Japan. Despite this, some experts warn that, although the golden cross is accepted as a forward-looking indicator, moving averages are based on past data and reflect past price movements, making such crosses lagging signals. The current golden cross on the weekly chart follows Bitcoin’s rise to $42,700, a more than 70% increase over the last four months.
What’s Next for BTC?
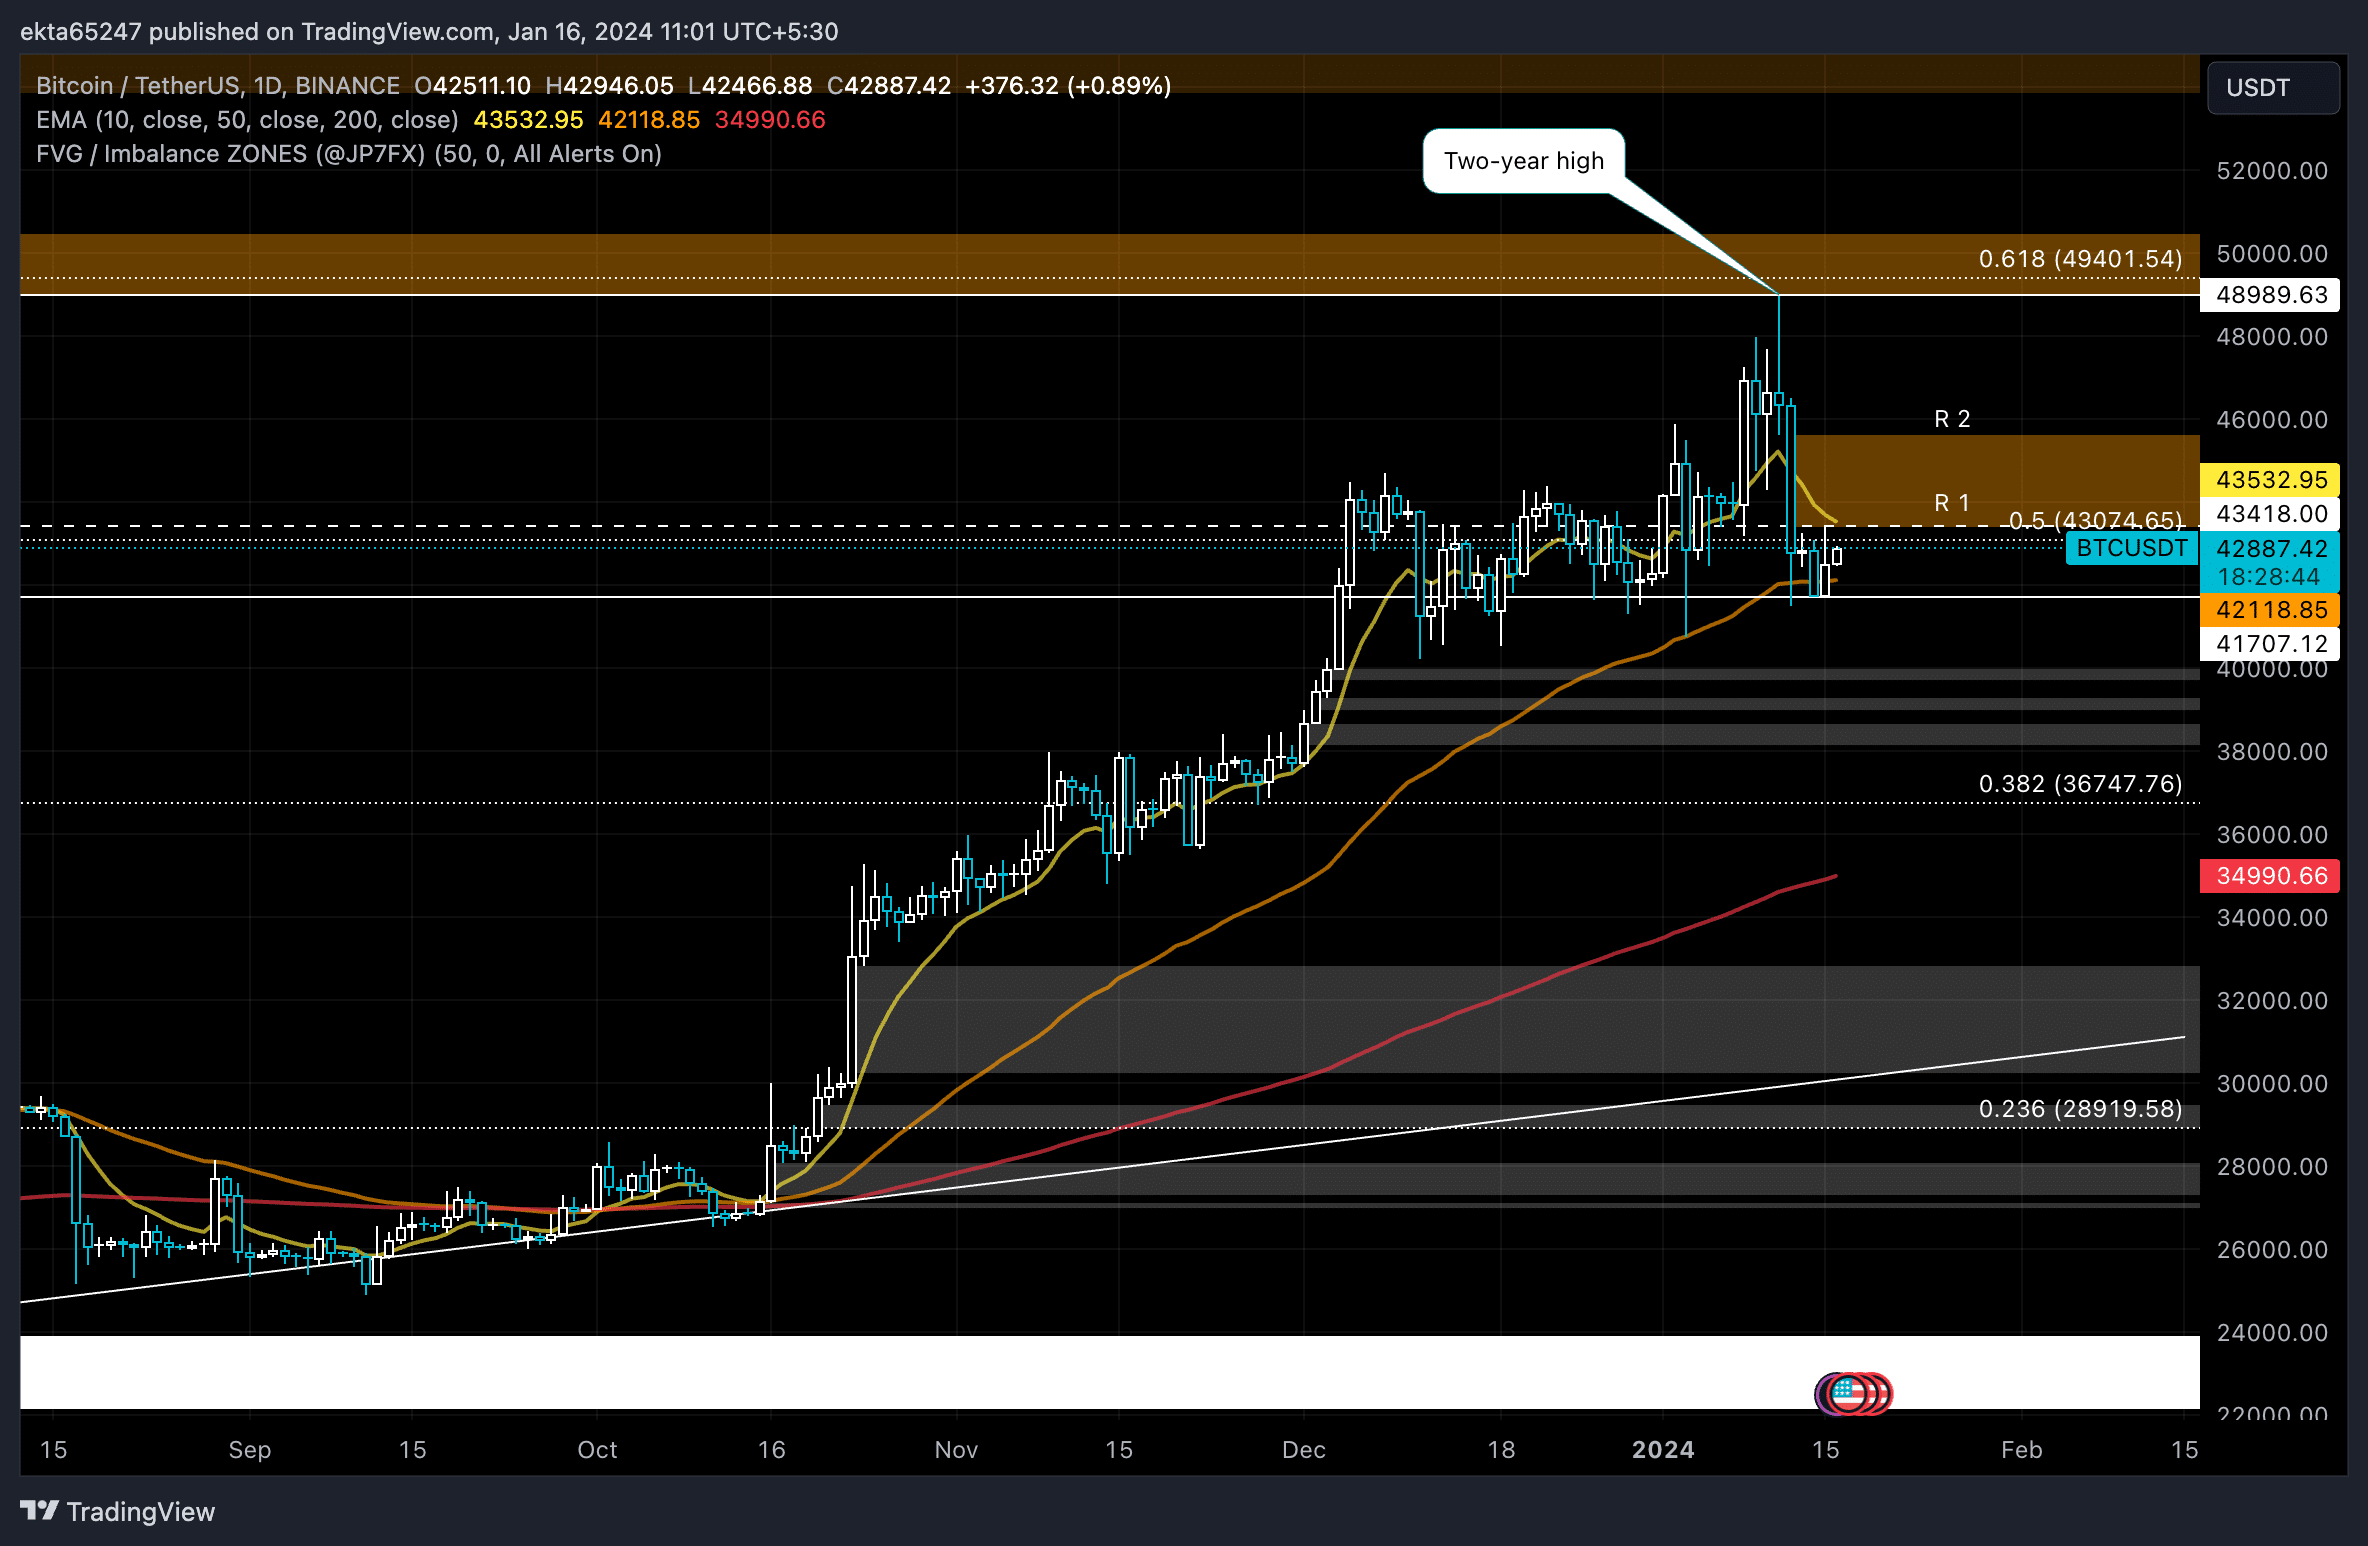
Since January 16, Bitcoin has been struggling to break out of the range it has been trapped in below the $43,000 level. Market participants are disappointed as BTC‘s price movement continues to be confined below the key resistance point of $43,418, which corresponds to the lower boundary of the chart’s downward imbalance zone.

Bitcoin is currently facing resistance at the $43,074 level, which is the 50% Fibonacci retracement level obtained from the decline between November 2021 and November 2022. In addition, the lower boundary of the imbalance zone ranging from $43,418 to $45,607 poses a second level of resistance in front of the price. Many analysts emphasize that after this region is filled, the largest cryptocurrency’s price is expected to continue its downward trend.

 Türkçe
 Español


