Bitcoin (BTC) price finally found strong support after Monday’s sharp decline and began a quick recovery. Despite this recovery, there is a significant hurdle that needs to be overcome for the bull run to continue.
Bitcoin Price Analysis
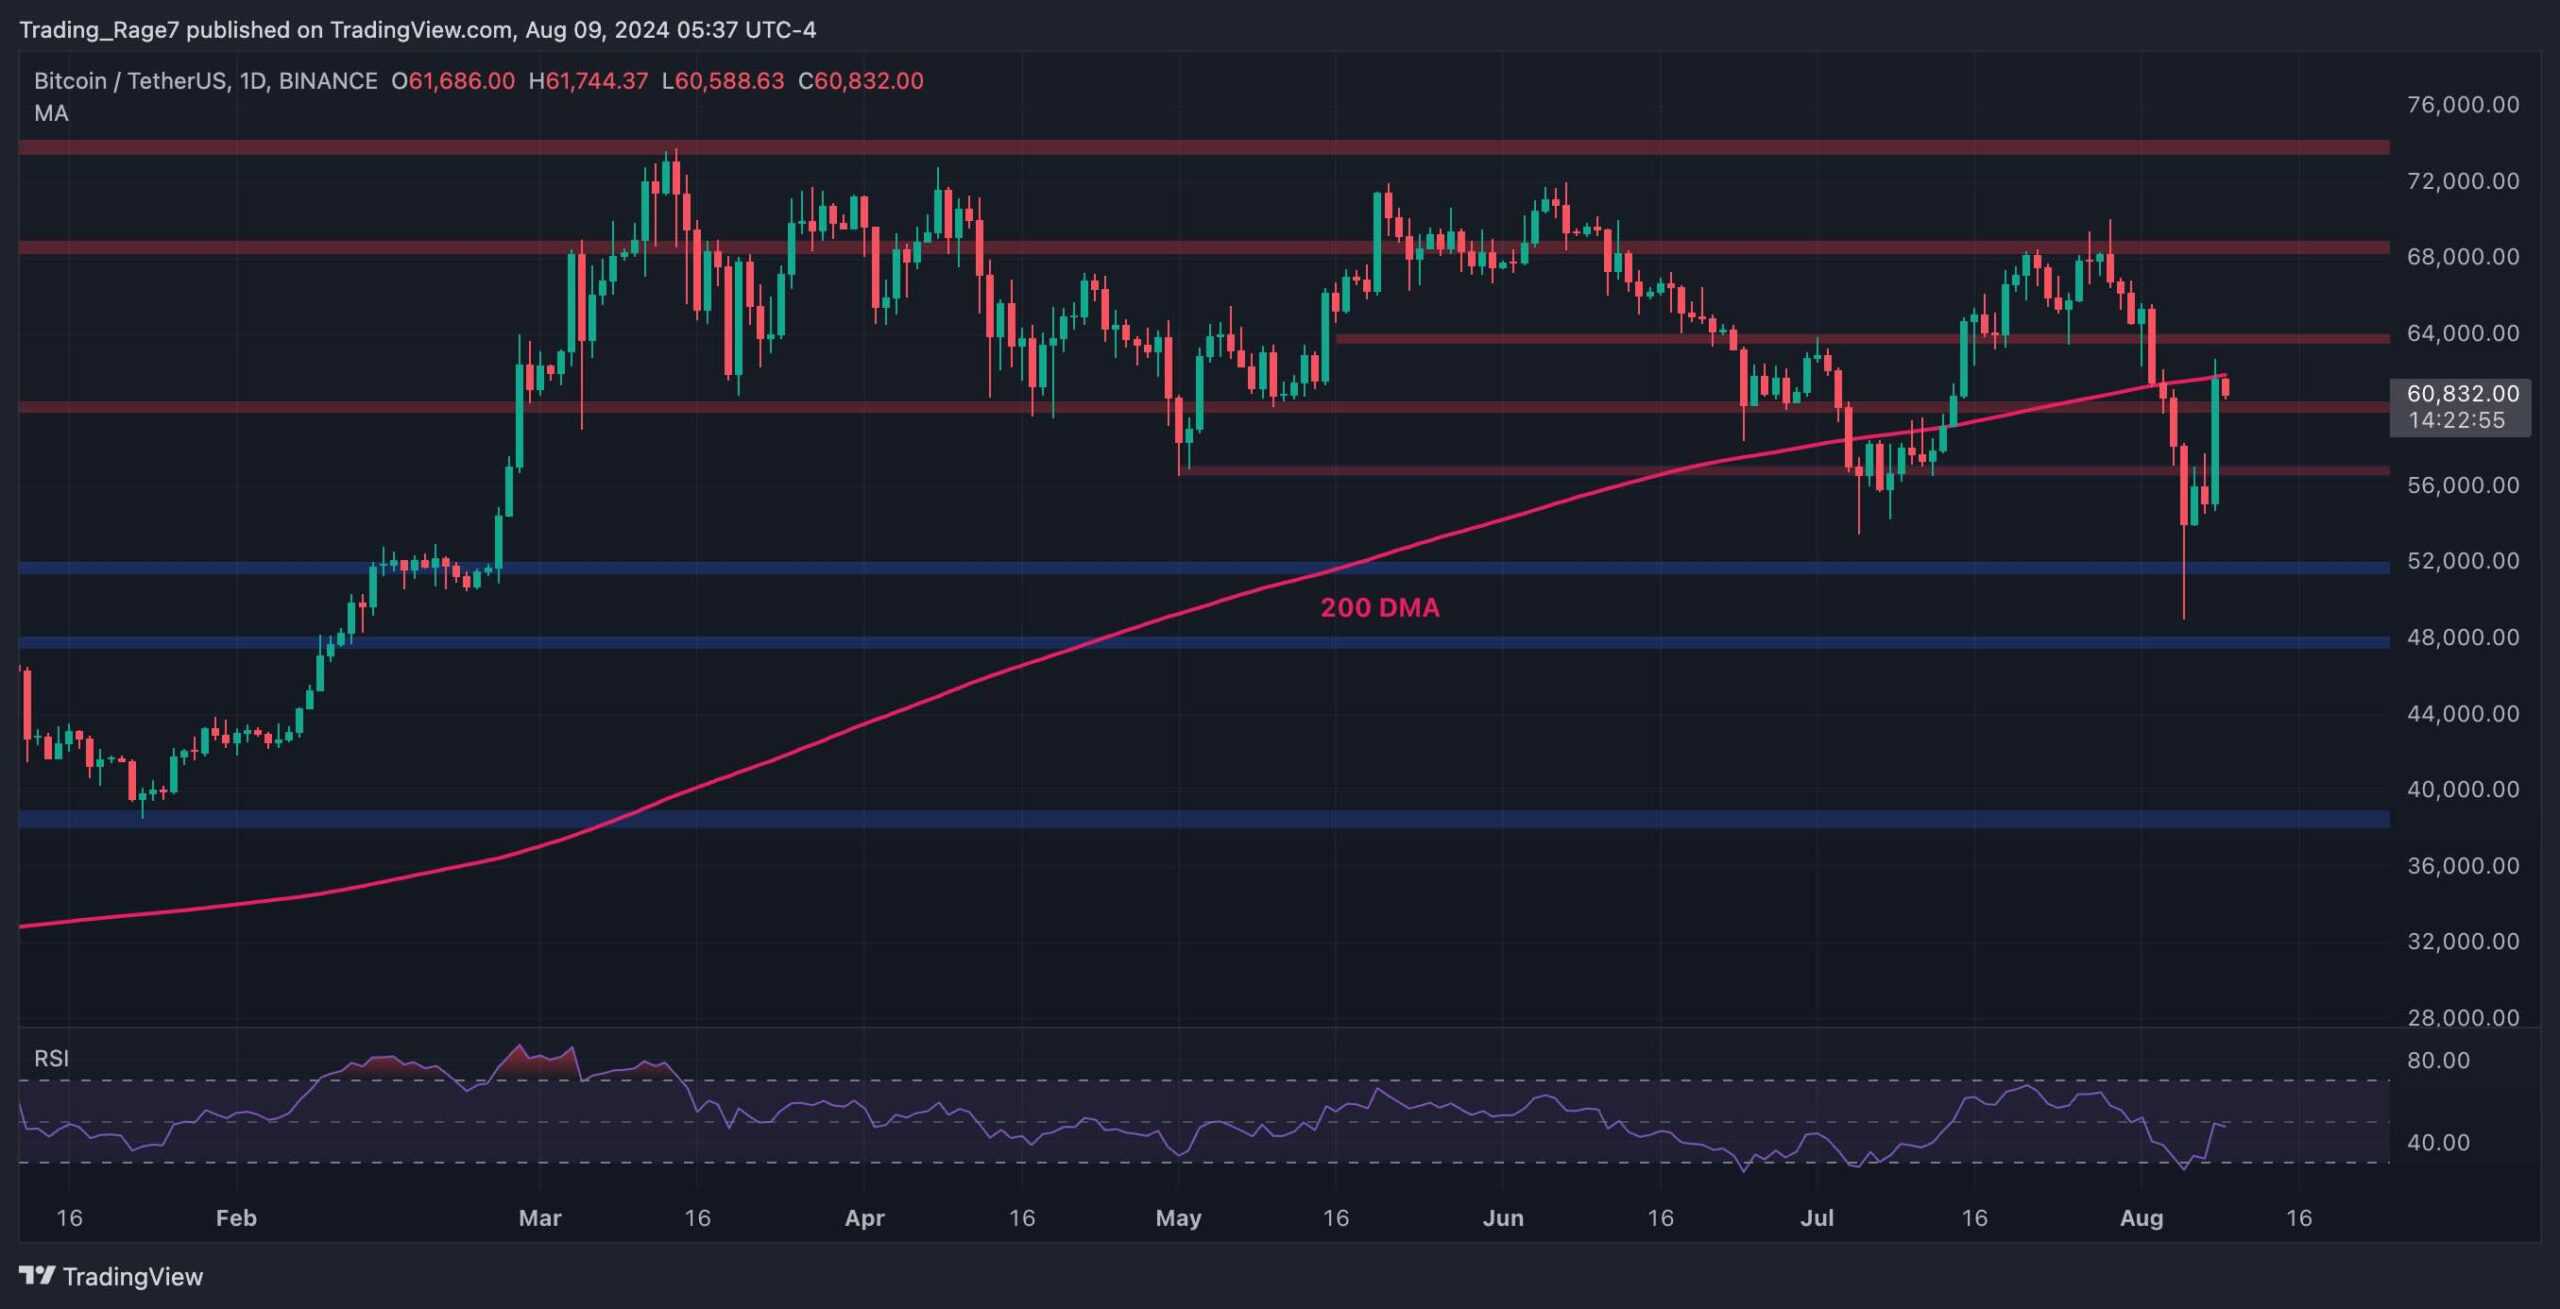
Bitcoin experienced a significant drop after failing to surpass the $68,000 resistance level last week. This drop halted around the $50,000 level, and the market has since climbed back above the $60,000 resistance. Currently, the price is struggling to stay above $60,000 while testing the 200-day moving average. This level is a critical indicator for determining the trend direction, and Bitcoin needs to break above this level to continue its bull run.

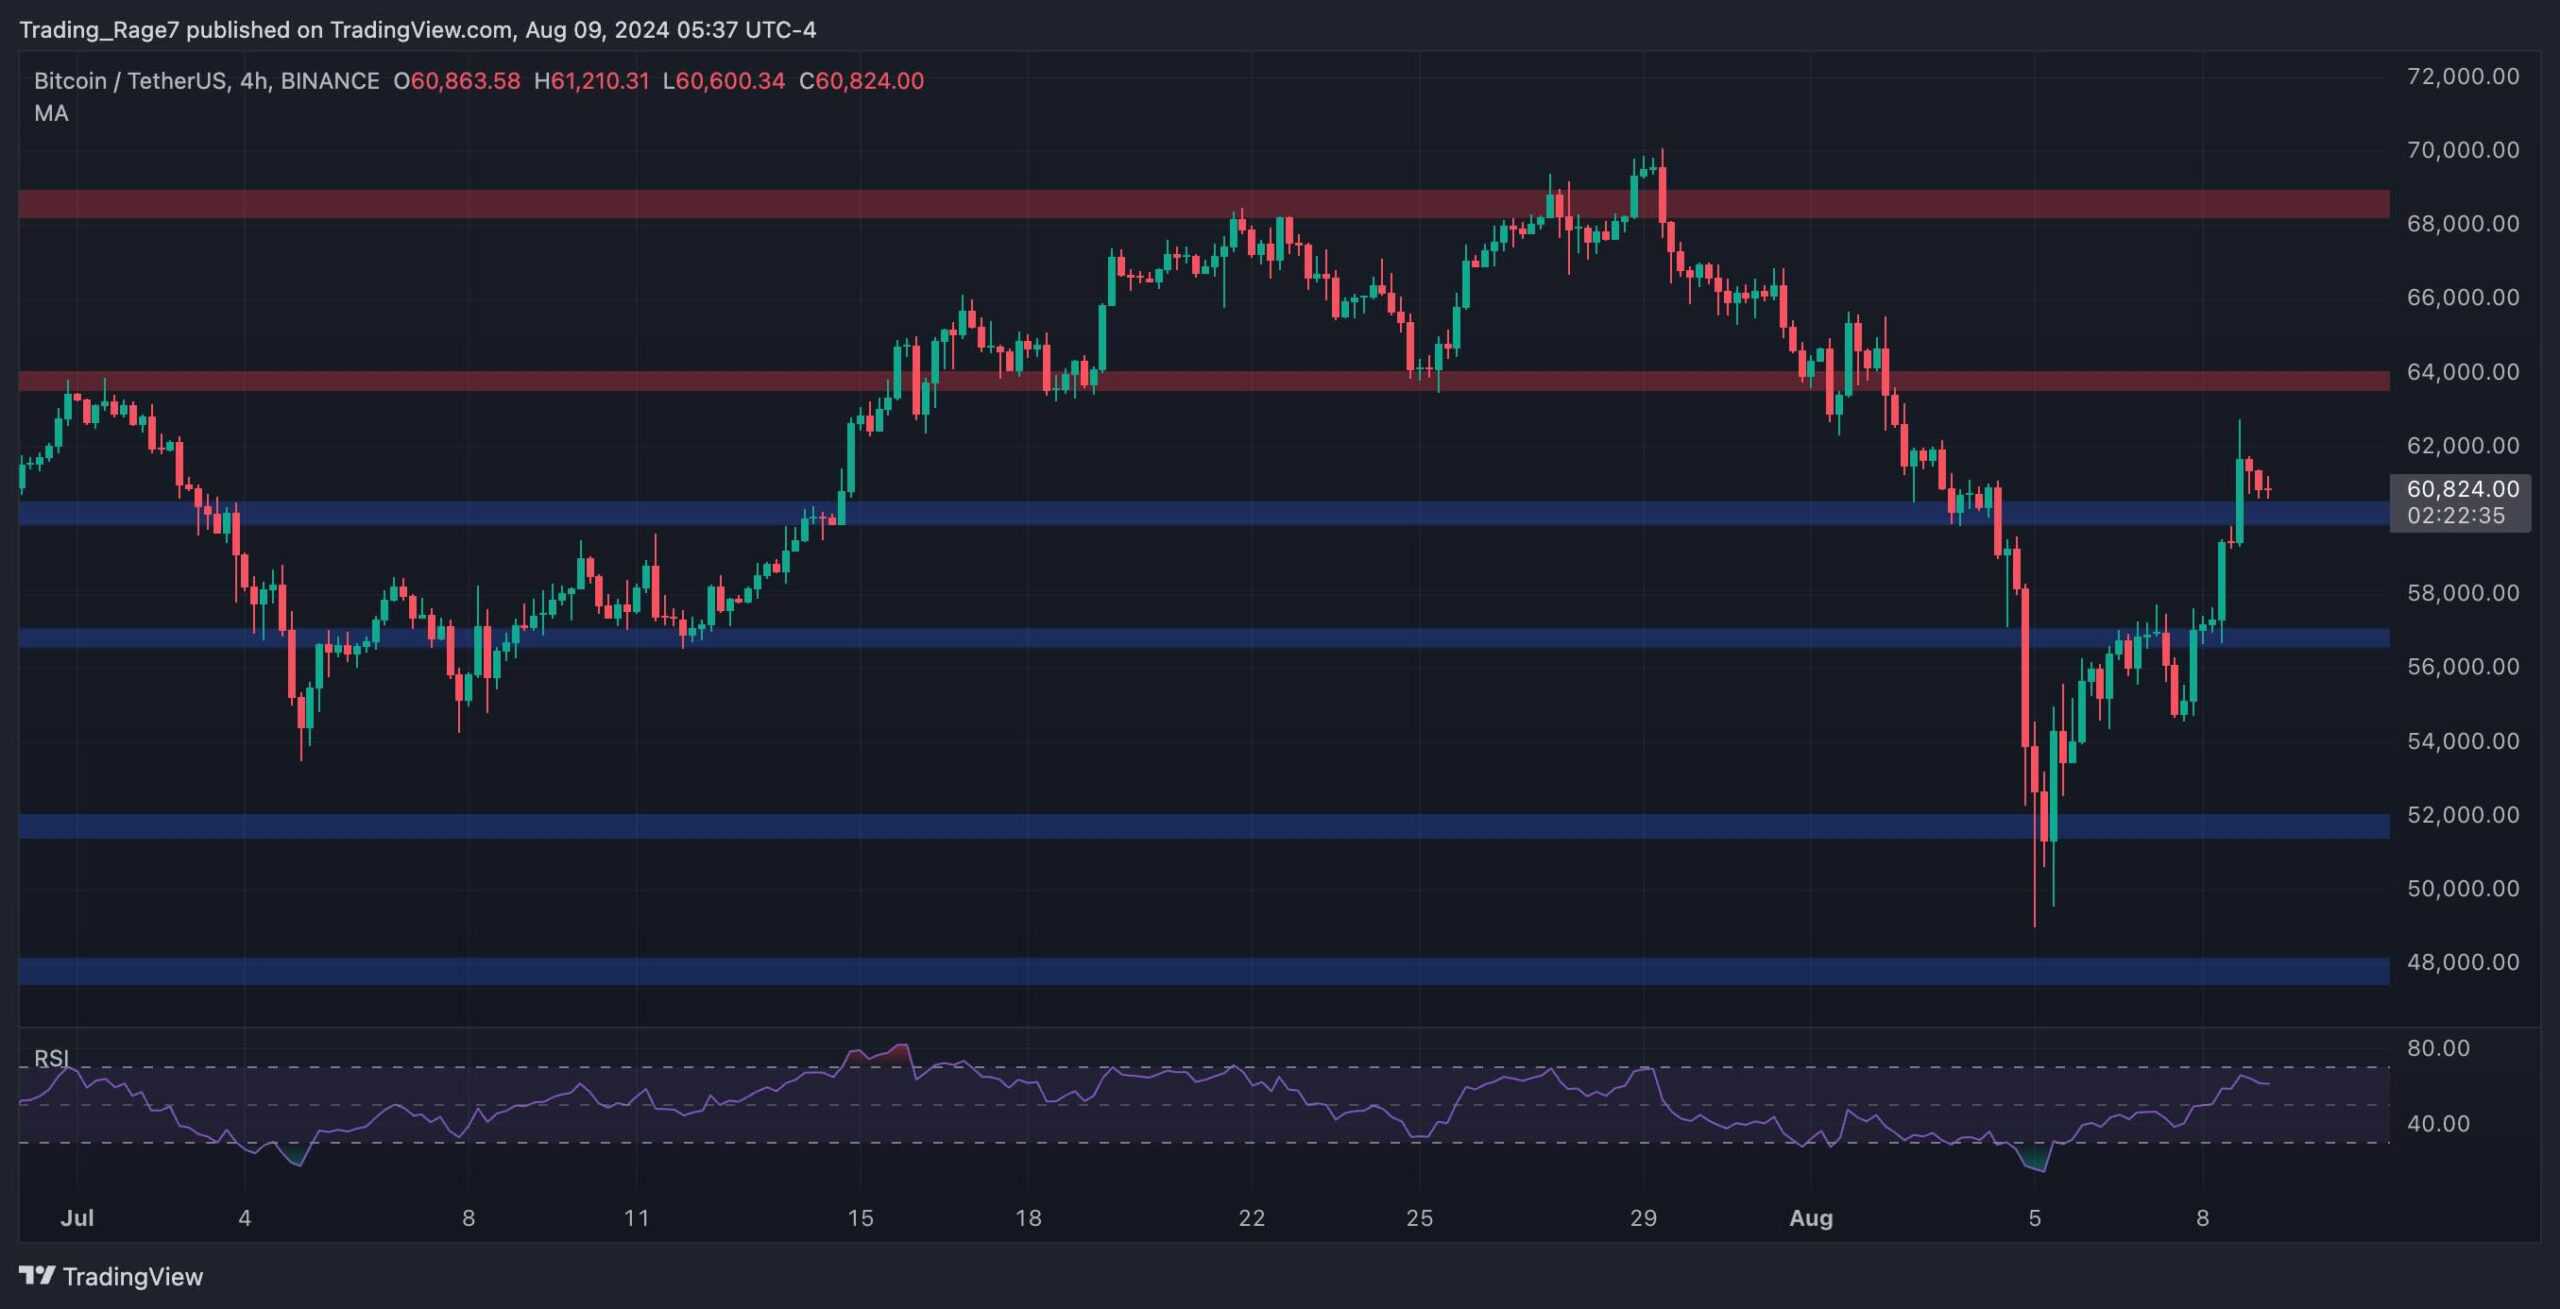
In a lower time frame, specifically the 4-hour time frame, the price of the largest cryptocurrency has been forming higher highs and lows following a V-shaped recovery from the $50,000 region. Although the market has breached the $57,000 and $60,000 resistances, this rise above $60,000 could be a ‘false breakout.’

In such a scenario, if the price quickly falls below this level, the downtrend may continue. Otherwise, the next target resistance level is $64,000. At this point, BTC could aim for a new all-time high.
Bitcoin Funding Rates
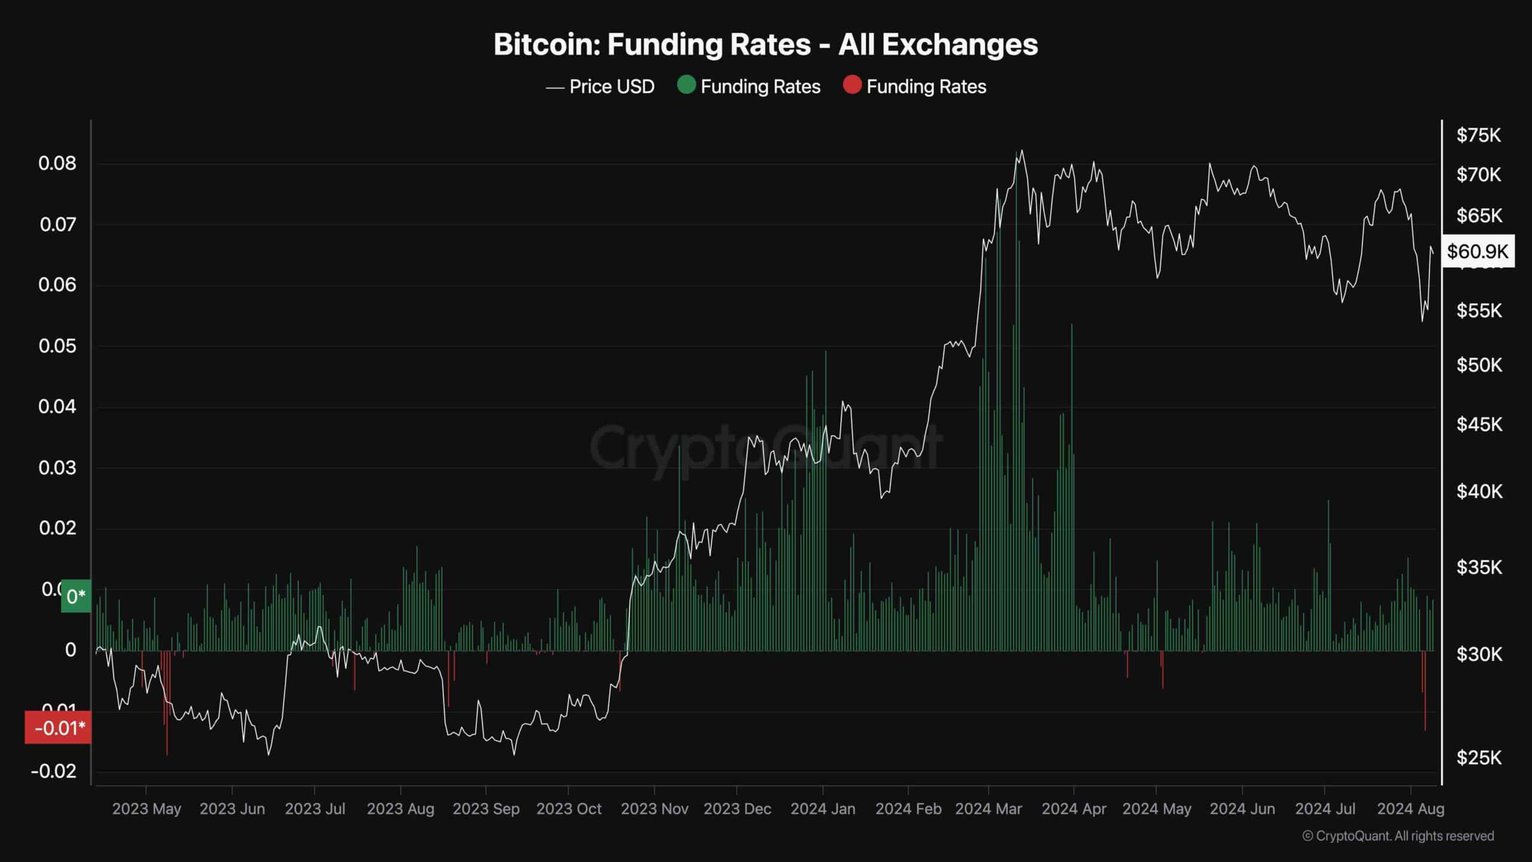
In recent months, the futures market has played a significant role in Bitcoin’s short-term price movements. Therefore, analyzing the sentiment in the futures market can be quite beneficial. The Bitcoin Funding Rates metric indicates whether buyers or sellers are more aggressive. Positive values indicate a bull market, while negative values indicate a bear market.

During the recent price drop, funding rates turned significantly negative, but they returned to positive as the price recovered. This situation usually indicates a market bottom, but this signal alone may not be reliable, and other factors should also be considered.

 Türkçe
 Español


