Bitcoin reached above $30,000 for the first time after two months on October 20. This indicates that Bitcoin may have a bullish movement, and Grayscale Investments’ application to the SEC for a new spot Bitcoin ETF may have triggered this rise. So, will altcoins continue this upward momentum along with Bitcoin?
BNB Chart Analysis
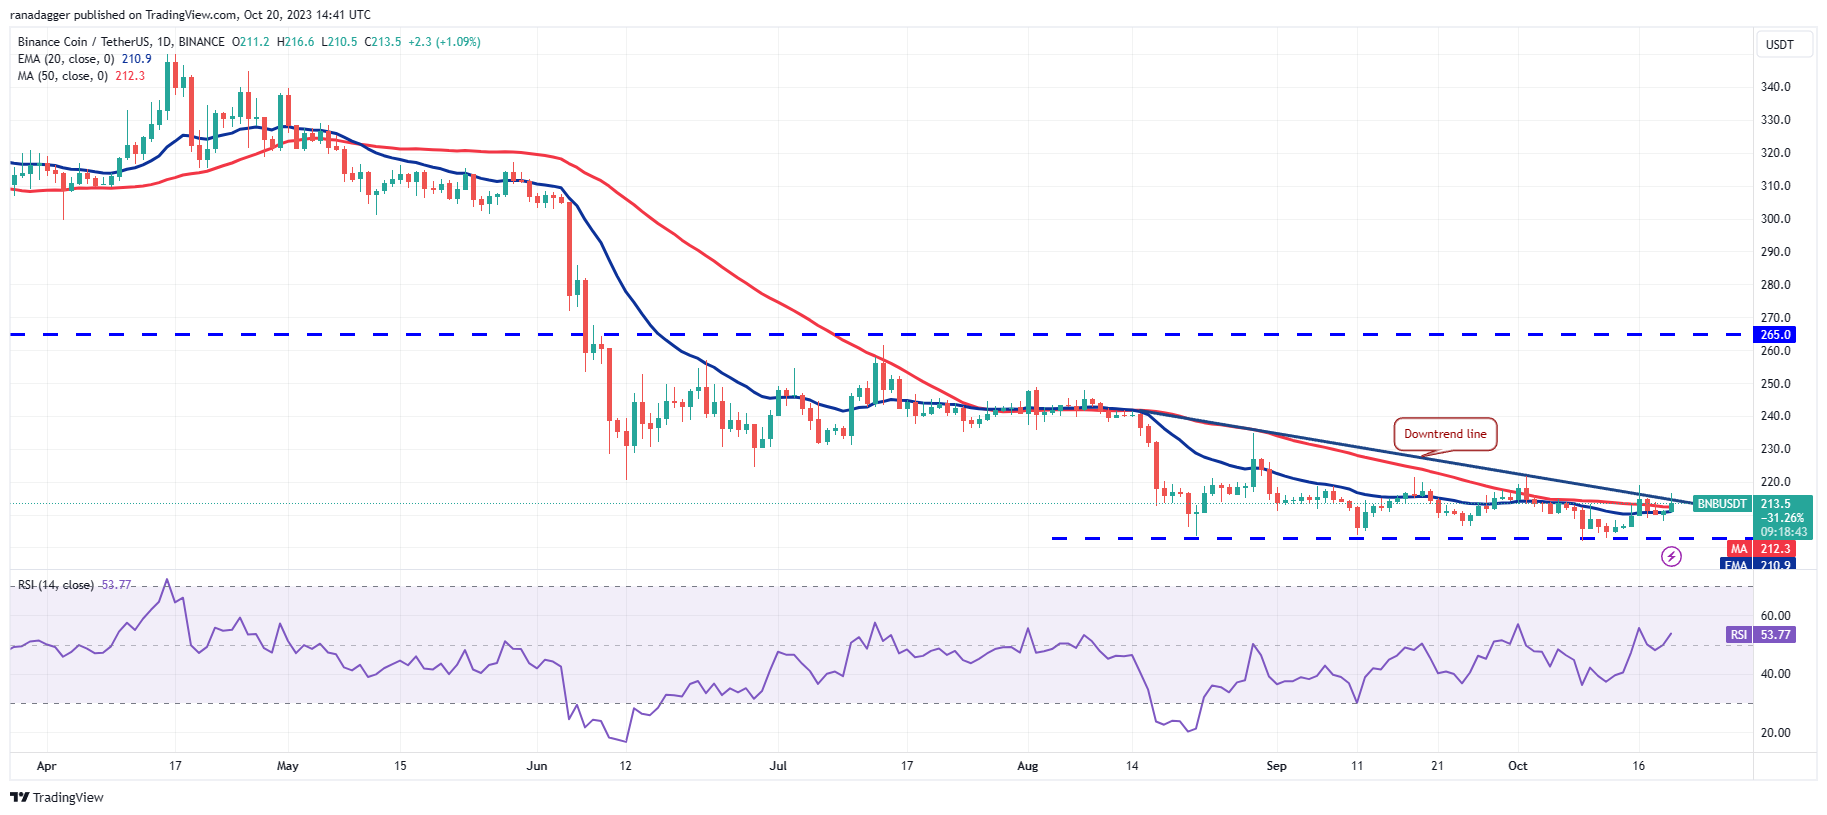
Binance‘s native token BNB broke below the downtrend line on October 16, but it is a positive sign that investors did not let the BNB price drop below the 20-day EMA level of $210. This development indicates a significant change that shifts from profit-taking during rallies to buying during declines.
Investors will once again try to pull the price above the downtrend line and protect the price. If they succeed, a rapid rise to $235 can be seen in the BNB/USD pair, and then the price can reach $250.

Cardano Chart Analysis
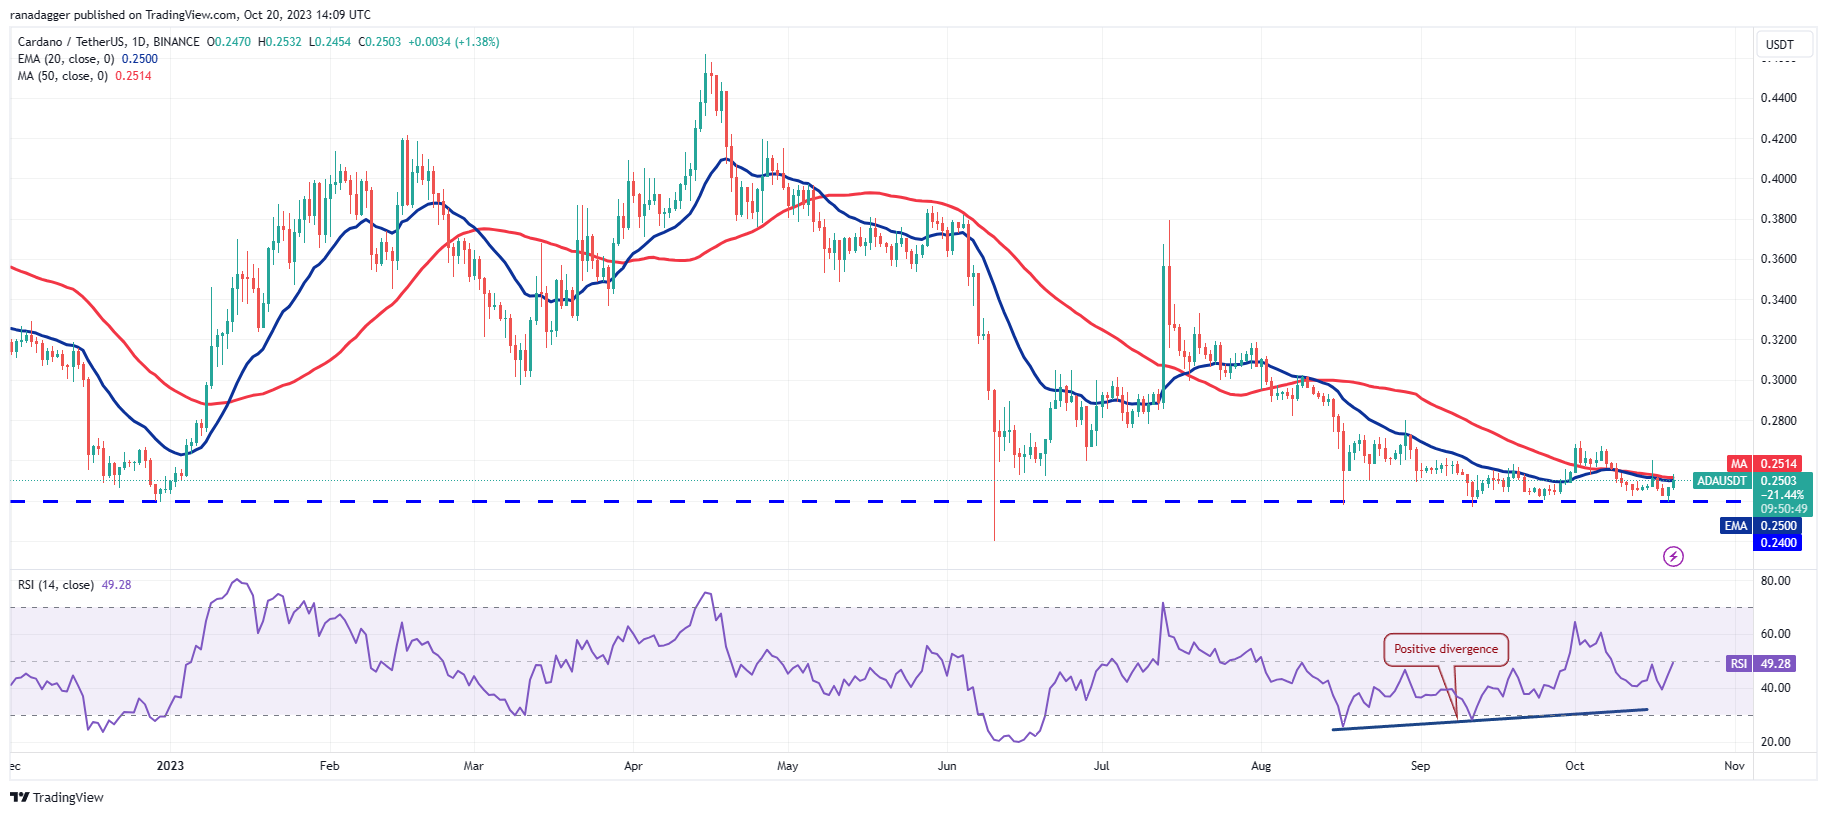
Cardano once again dropped to a strong support level of $0.24 on October 19 and received strong support from investors at this level. The positive divergence in the RSI level indicates a decrease in the downward momentum in this pair. The ADA price has risen to a moving average level that can serve as a strong resistance. If investors can break this resistance, the levels of $0.27 and $0.28 can be seen in the ADA/USD pair.
If the price faces selling pressure at the $0.28 level, it will indicate the formation of a range for several days. To trigger the bears’ downward move, the price needs to drop below the $0.24 level. The next support levels on the ADA chart are $0.22 and $0.20.

Toncoin Chart Analysis
TON dropped below the 61.8% Fibonacci level of $1.98 on October 12. However, bears could not take advantage of this weakness, and bulls managed to bring the price back above $1.98 by buying the dip on October 17. Bears are trying to stop the recovery at the $2.20 level in the TON/USD pair, but bulls are not letting the price drop below the moving averages at this level. This situation has been noticed by many investors, and declines are starting to be considered as opportunities for TON.
If the TON price surpasses the $2.20 level, the head and shoulders pattern will be completed in the TON/USD pair. The target level of this structure is $2.47. However, if the price falls below $1.89, it will invalidate this formation.


 Türkçe
 Español


