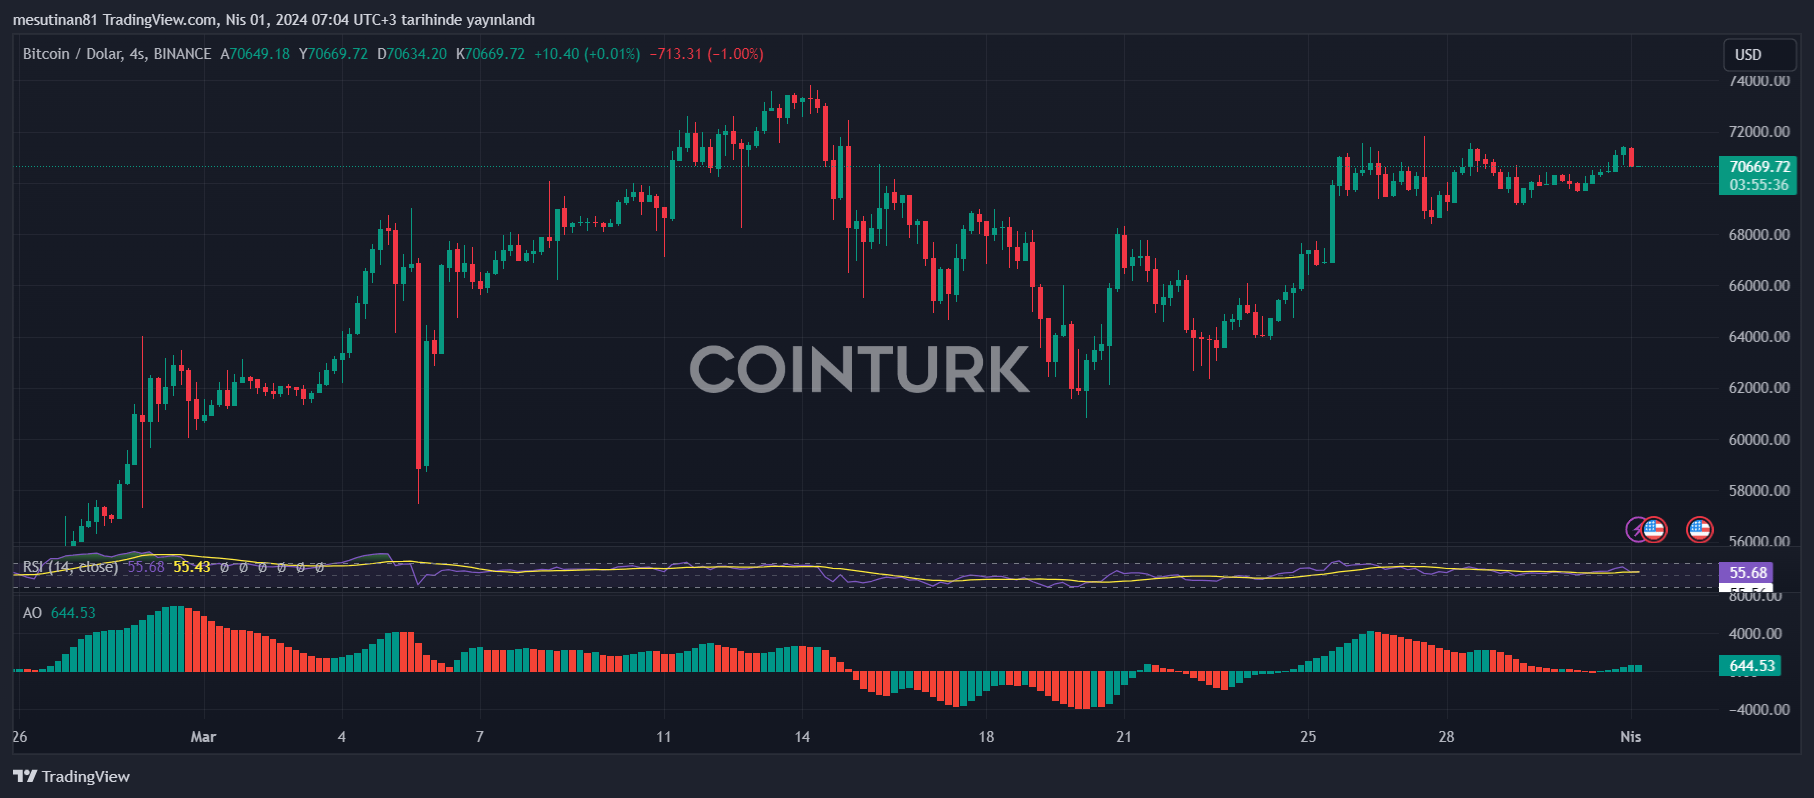
Bitcoin price is currently sustaining above the $70,000 resistance region. It is anticipated that bulls might consolidate in this range a bit longer before making a move towards the $75,000 target. What are the expectations for Bitcoin in the first days of April? Let’s examine the details together.
Bitcoin Price Above $70,000
According to recent data, Bitcoin price is attempting to gain momentum above the $71,500 resistance area. Trading above the $70,500 level and being above the 100-hour simple moving average provides some hope to investors. On the hourly chart, a short-term ascending channel with support at $70,750 is observed.
If the pair manages to surpass the $71,500 resistance area, a new rally could be predicted in the near future. Bitcoin price has established a solid base above the $69,000 resistance area in recent days. However, it needs to climb above the $70,000 resistance area to re-enter a positive zone.
It was observed that the price broke the $71,000 level but bears are active below the $71,500 resistance. So far, the highest level reached was around $71,306, and the price is currently consolidating gains.
What Are the Critical Levels?
It seems that the price’s upward movement continues near the 23.6% Fib retracement level. Bitcoin is currently trading above the $70,500 mark and the 100-hour simple moving average. Additionally, the presence of a short-term ascending channel with support at $70,750 on the hourly chart is noteworthy.
The immediate resistance is near the $71,300 level. However, the first major resistance level is anticipated to be at $71,500. If a clear move above the $71,500 resistance area is observed, the price is expected to enter a strong uptrend. In this case, the price could even surpass the $72,500 resistance area in the near term. The next major resistance level is near the $73,500 region.
If BTC Fails to Surpass the $71,200 Level
Bitcoin continues to quicken the pulse of investors with its recent volatile trend. However, if it fails to rise above the $71,200 resistance area, a new downward wave is expected for the cryptocurrency.

BTC/USD pair, if unable to climb above the $71,200 level, could experience a pullback towards the immediate support level at $70,750. The proximity to the channel trend line should also be considered. The first major support level is around $70,200, which represents the 50% Fibonacci retracement level of the rise from $69,128 to $71,306.
Moreover, the $70,000 level emerges as a significant psychological support. If the price drops below this level, it could gain downward momentum towards the $69,120 level. In the event of further losses, the price could potentially retreat to the $68,500 support area in the near term.
What Do Technical Indicators Suggest?
Looking at technical indicators, we see that the hourly MACD is losing momentum in the bullish zone. However, the hourly RSI (Relative Strength Index) value for BTC/USD is still above the 50 level.
The main support levels are determined as $70,750 and then $70,200, while the resistance levels are highlighted as $71,200, $71,500, and $73,500.


