Leading crypto analyst TechDev has recently reported that a compelling case for a significant upward breakout in Bitcoin (BTC) has formed, based on the convergence of fundamental technical indicators. The anonymous analyst, known as TechDev, shared his observations with his followers on social media platform X, pointing out bullish signals stemming from various technical indicators.
Interpreting Bitcoin through Wyckoff Accumulation Scheme and Gauss Channel
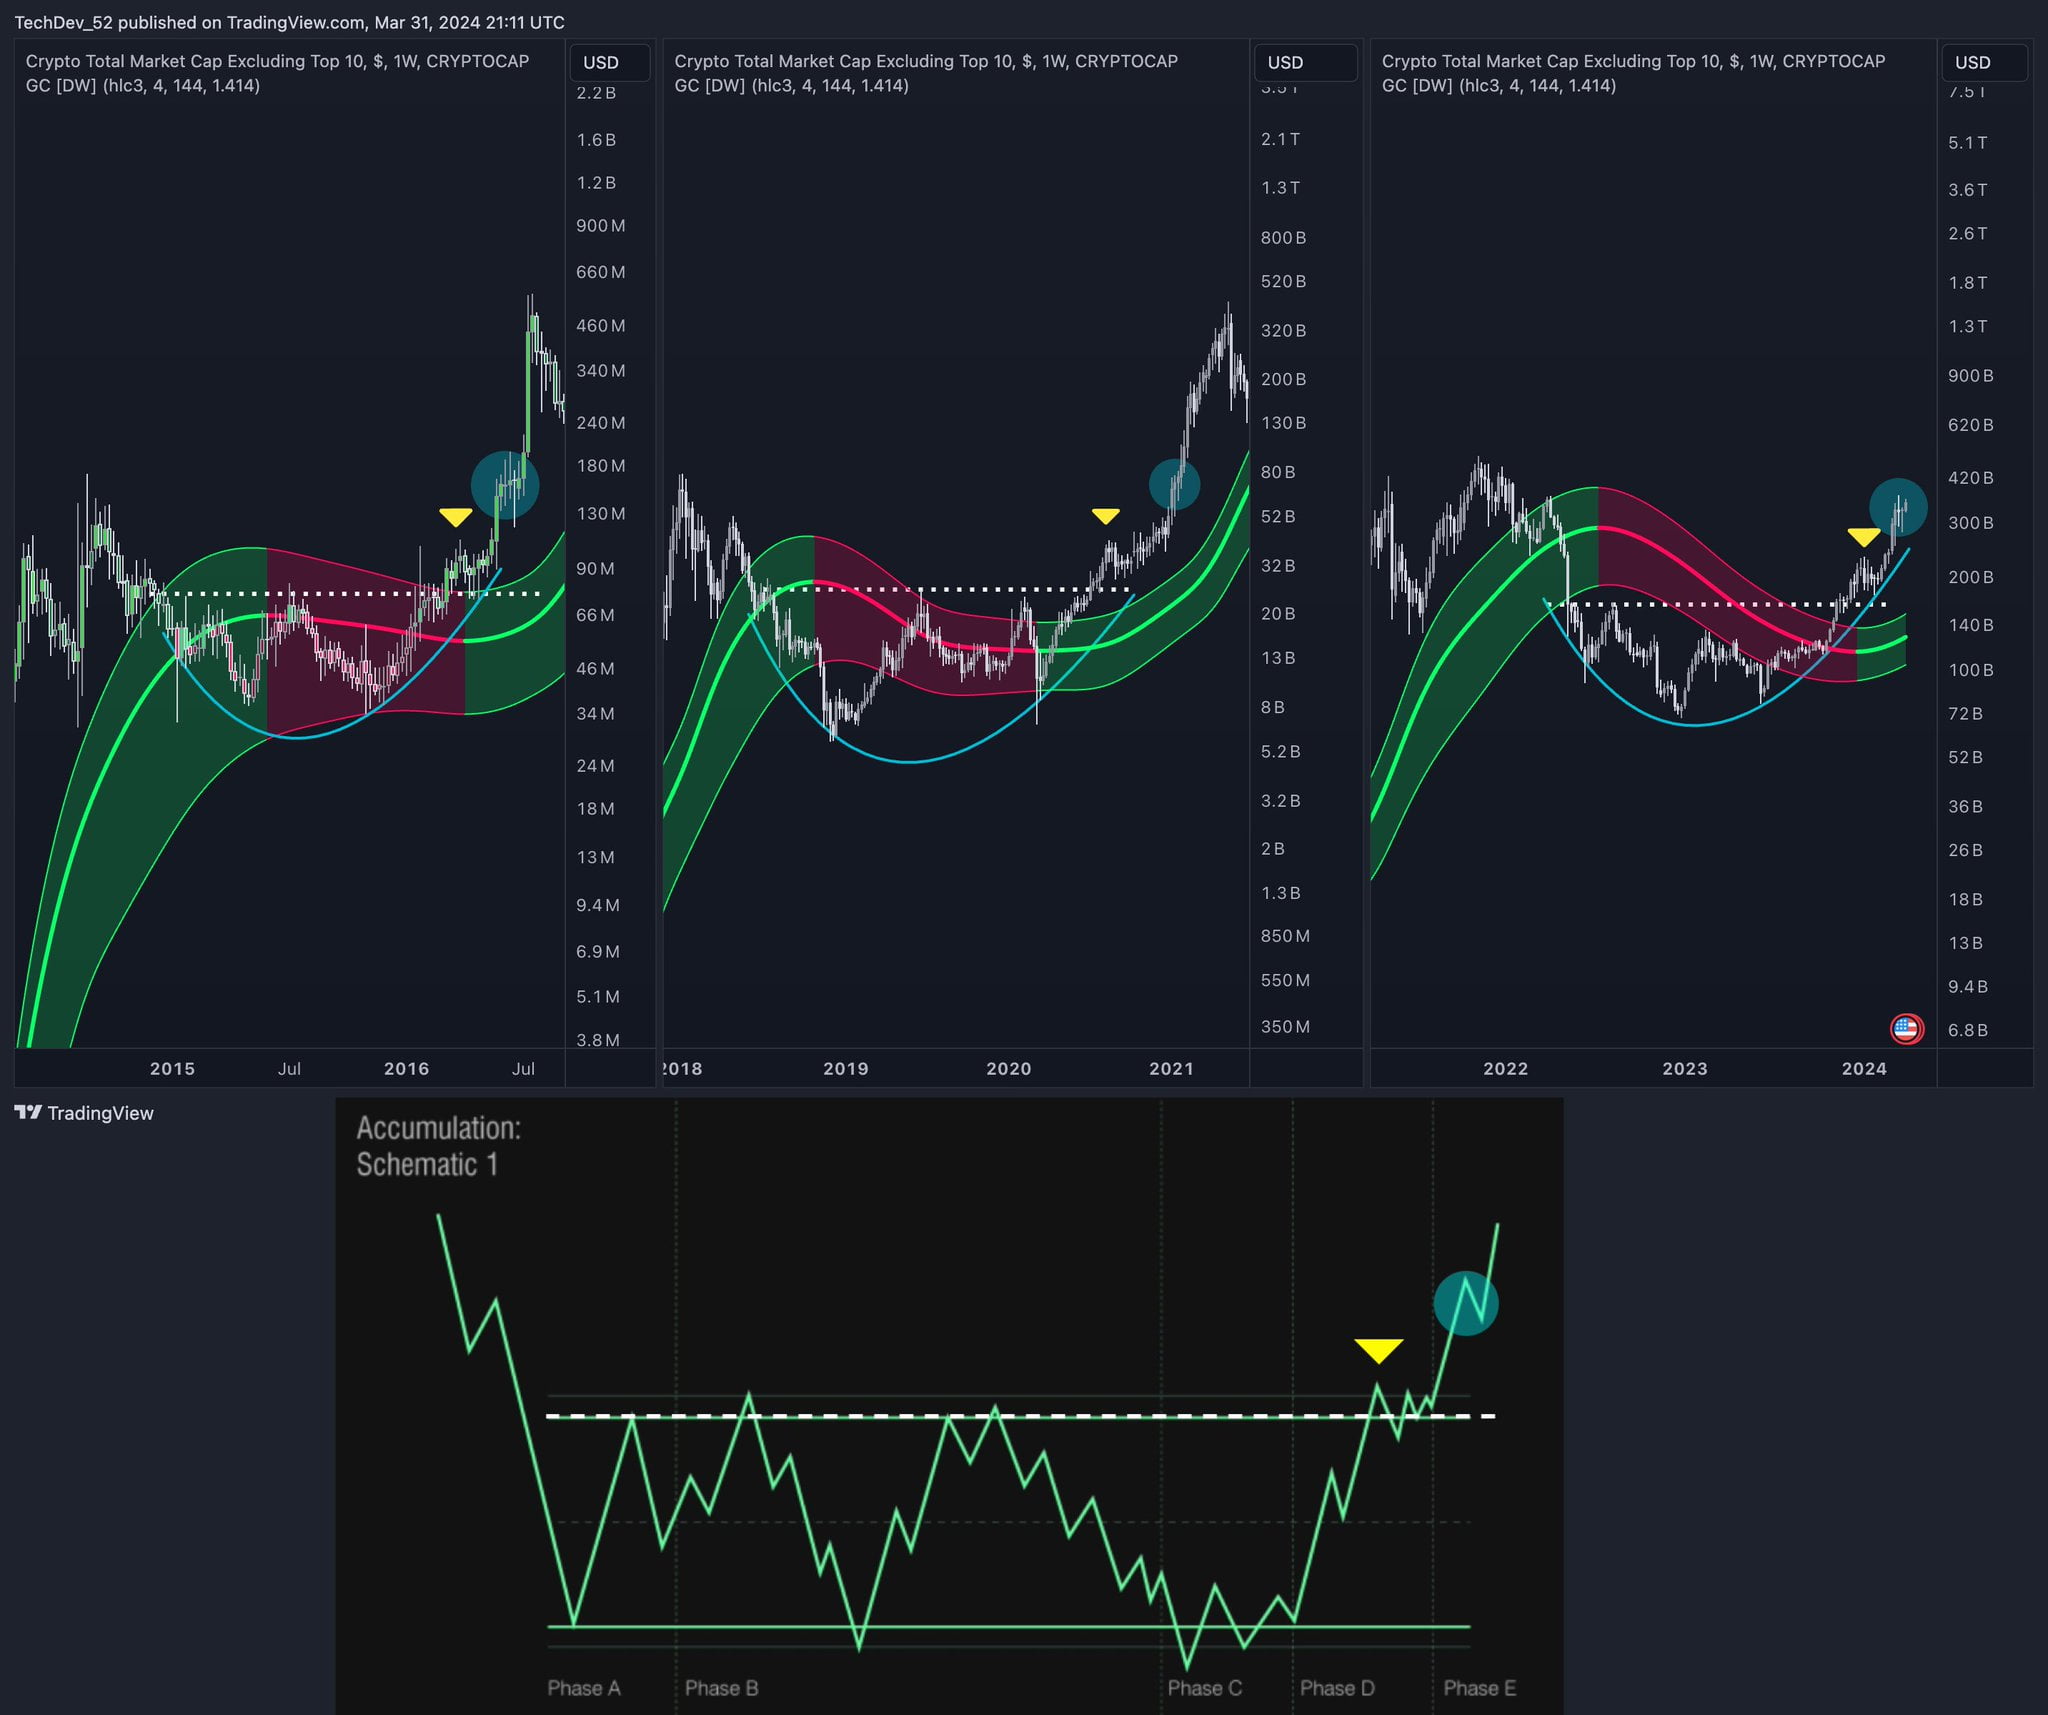
TechDev mentioned an optimistic outlook for Bitcoin, stemming from the Wyckoff accumulation scheme, which is often used in technical analysis and generally considered a strong bullish signal. He also emphasized the Gauss channel, a momentum indicator signaling an upcoming bullish trend and a very important moment for potential upward momentum.

Analyzing the current Bitcoin chart, TechDev highlighted that the Wyckoff accumulation scheme is progressing towards the E phase, which is typically associated with a formation stage or characterized by an upward price movement. This observation adds credibility to the analyst’s expectation of a significant change in the market.
Among other valuable observations shared by the analyst are the application of the Gauss channel to the market value of cryptocurrencies excluding the first 10, and the emergence of a repeating pattern observed before significant bullish trends in both 2016 and 2020. These historical parallels support the analyst’s confidence in the current market trajectory.

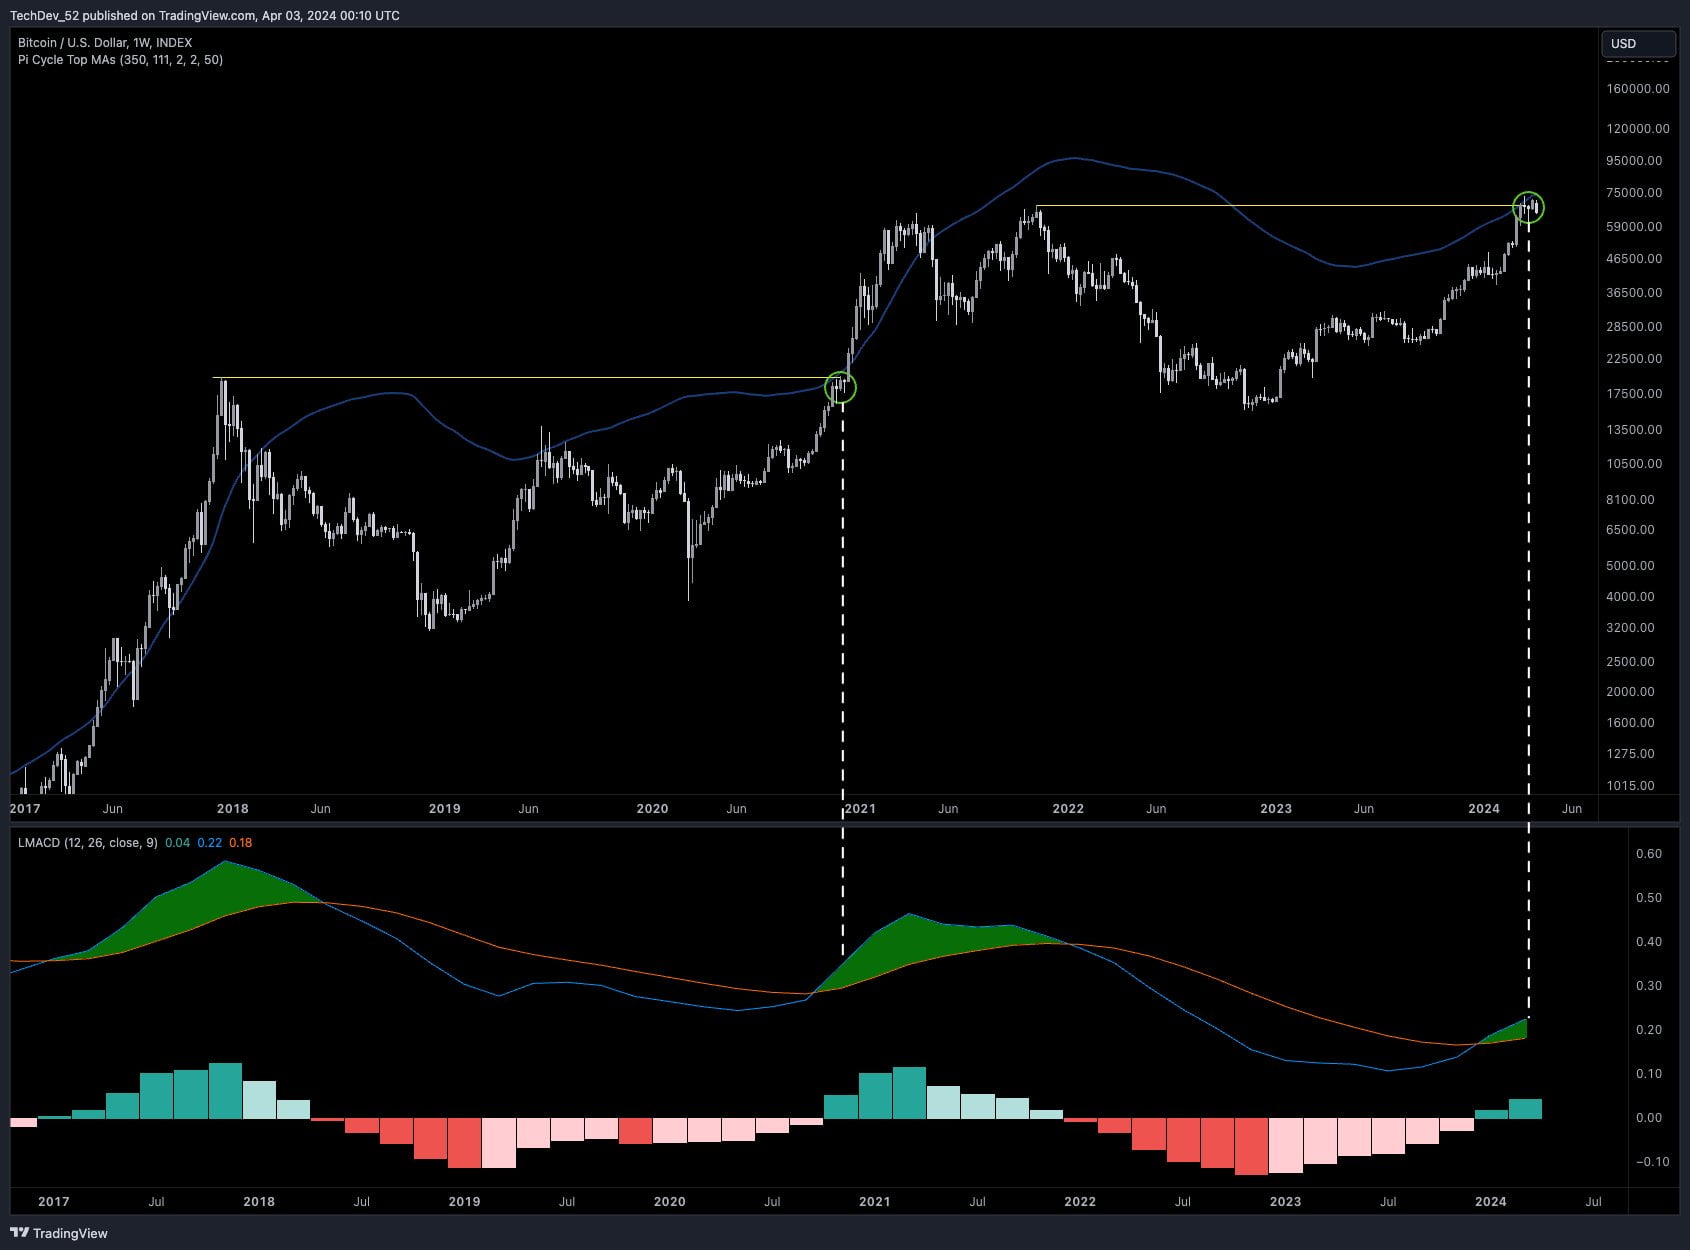
TechDev’s analysis extends to Bitcoin’s positioning in the weekly time frame according to fundamental indicators, drawing comparisons to the period before the largest cryptocurrency reached its all-time high in 2020. According to the analyst, especially the alignment of Bitcoin’s price with the previous ATH and the 350-day moving average, and the positive two-month MACD, indicate a strong potential for price increase.
Two Key Technical Indicators Signal Strong Bullish Movement
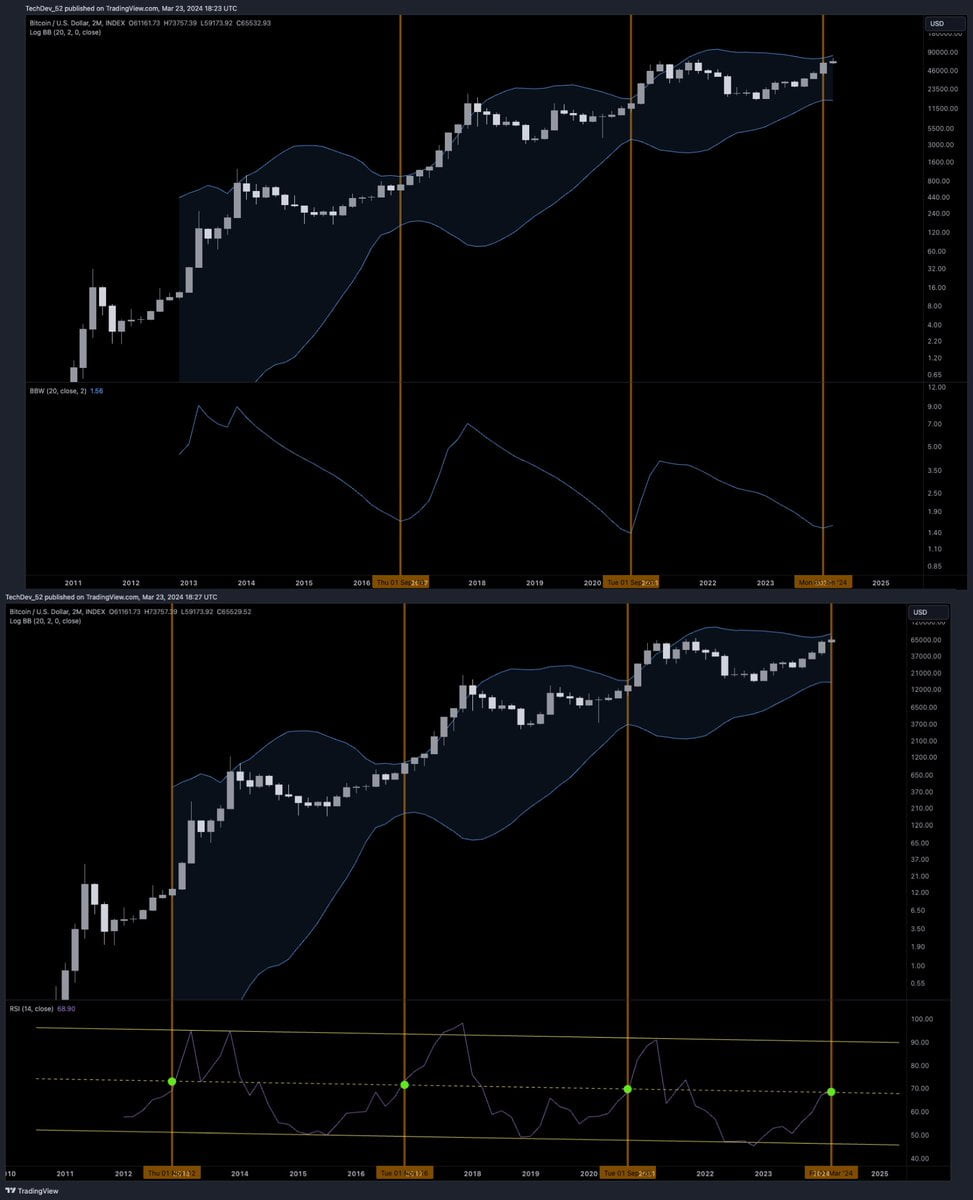
In addition to these indicators, TechDev drew attention to Bitcoin’s price chart in the two-month time frame, focusing particularly on the Bollinger Bands Width (BBW), a volatility indicator that signals sharp short-term movements.

The expansion of the BBW and the Relative Strength Index‘s (RSI) crossing above the middle of the channel further strengthen the analyst’s bullish expectations, indicating that all conditions are favorable for an upward price movement.

 Türkçe
 Español


