Türkçe
 Español


On December 19th, Bitcoin‘s price fell from its daily high of $43,402 to $42,239, marking a drop of about 2.64%. This decline brought about striking results in chart analyses for Bitcoin, which was trading at $42,363 at the time of writing. We are examining what could happen in the upcoming period.
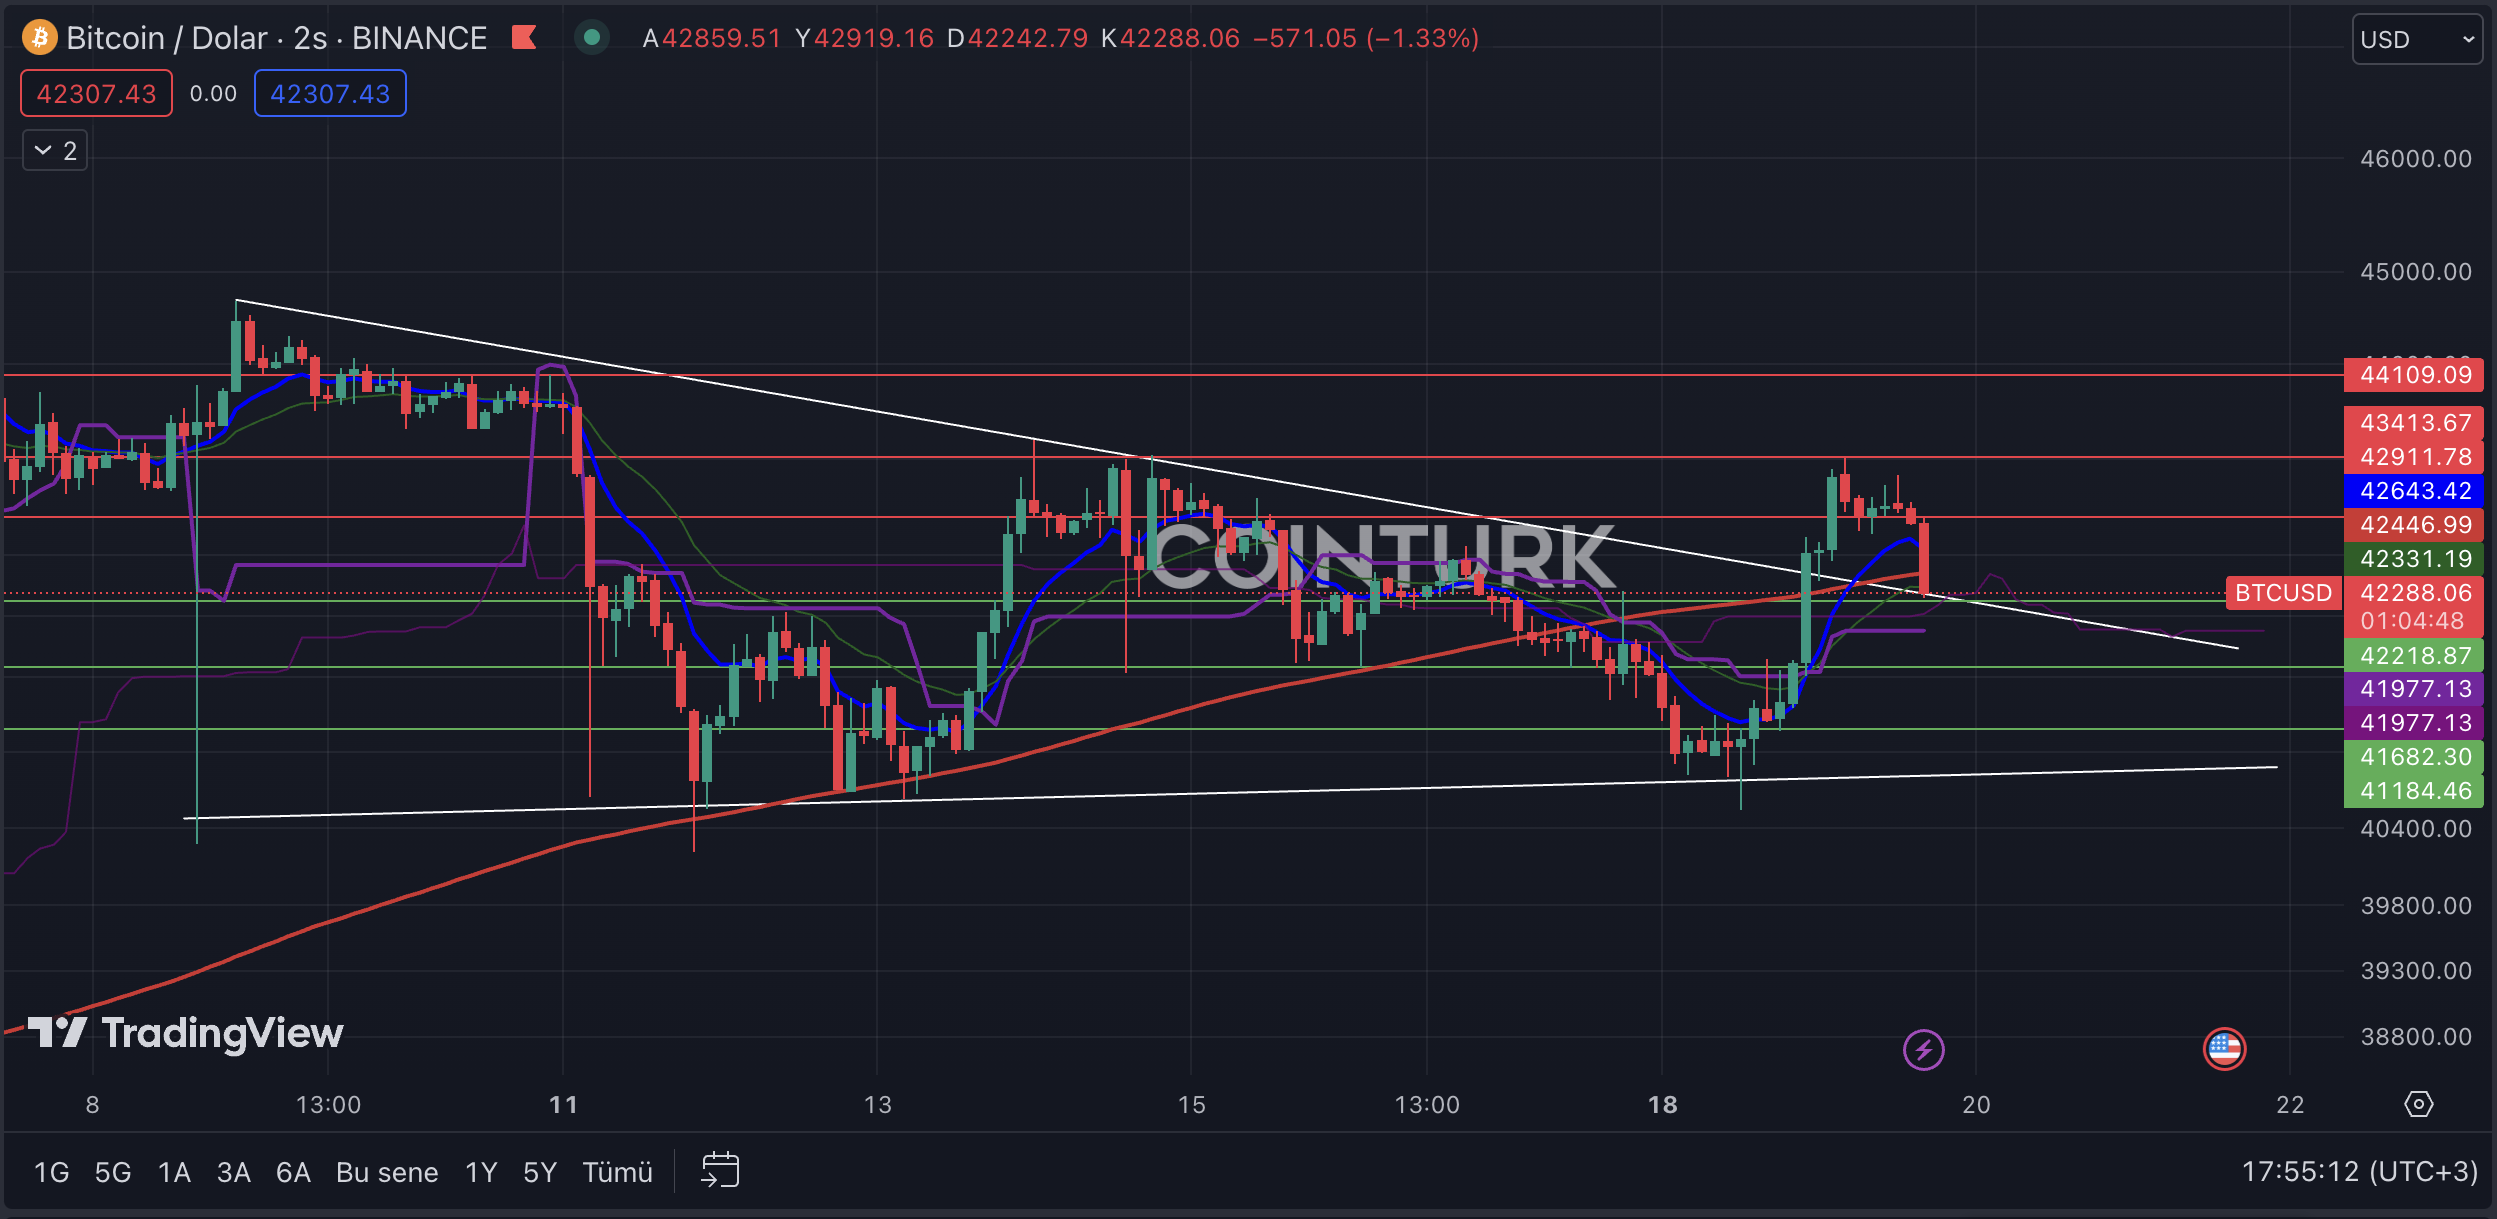
Bitcoin Two-Hour Chart Analysis
In the two-hour chart analysis, the first notable pattern in the Bitcoin chart is the contracting wedge formation. In this formation, BTC, which touched the support level on December 18th, managed to break the resistance line in the latest bar formations. However, despite an expected acceleration in the upward momentum, a significant drop occurred in the last bar formation, and BTC’s price tested the resistance line as support.
The most important support levels to watch on the two-hour Bitcoin chart are, respectively; $42,218 / $41,682 and $41,184. In particular, a two-hour bar closing below the $42,218 level, which intersects with the formation’s resistance line, will put the anticipated bullish scenario on hold for a while and create selling pressure in the short term.
The most important resistance levels to watch on the two-hour Bitcoin chart are, respectively; $42,911 / $43,413 and $44,109. Especially, a two-hour bar closing above the $43,413 level, which has been a significant barrier in the recent upward momentum, will facilitate an increase in momentum for the BTC price.
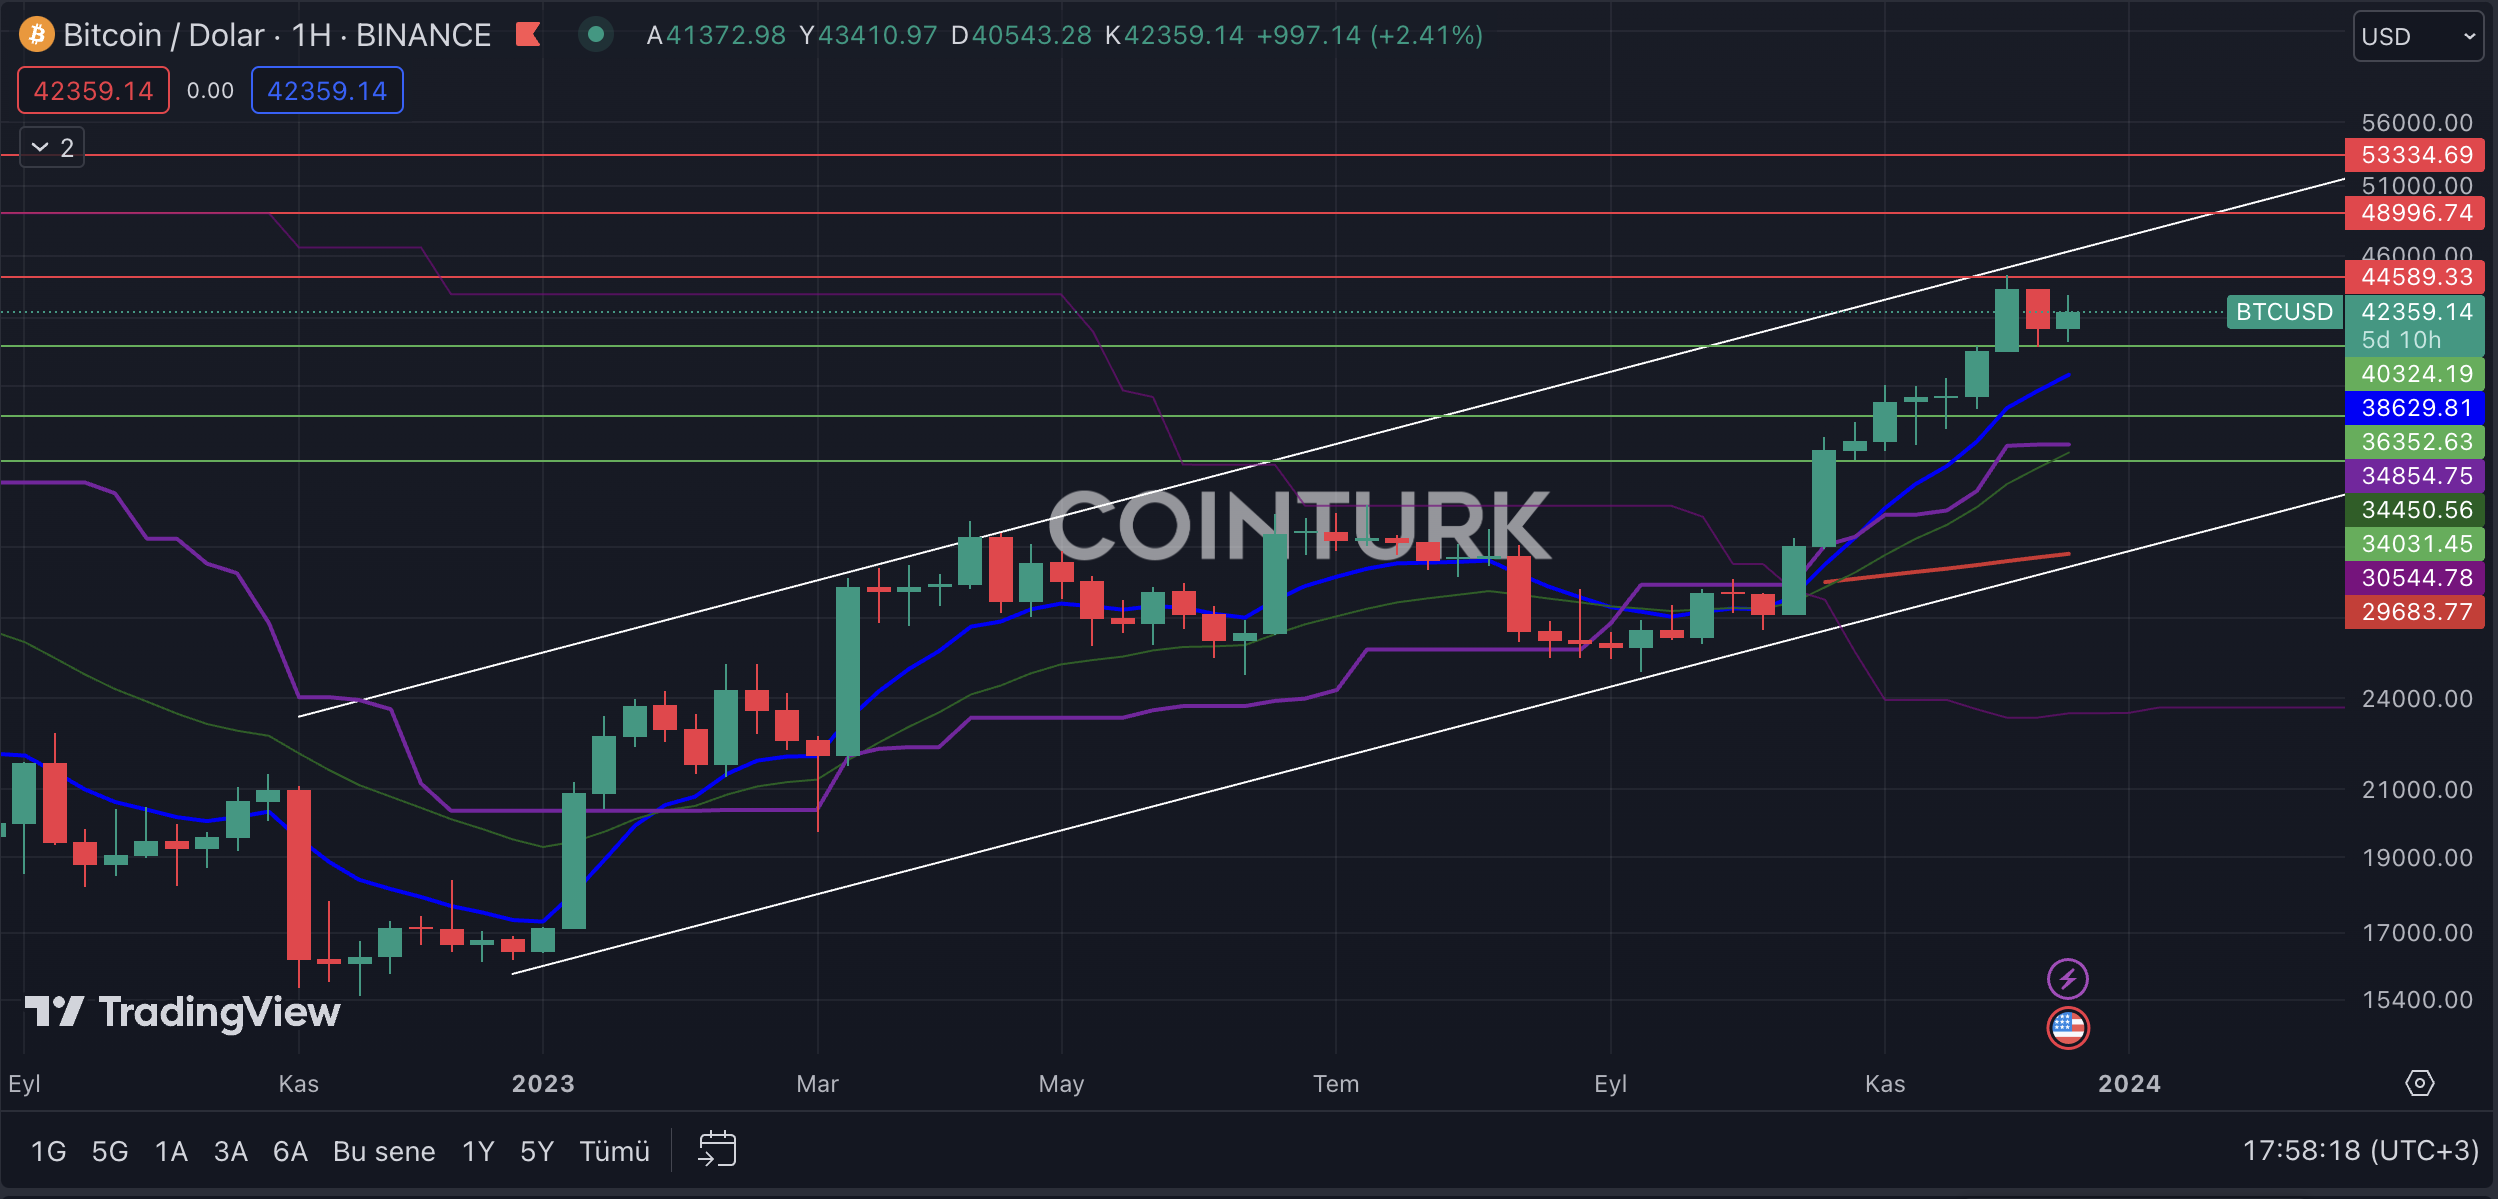
Bitcoin Weekly Chart Analysis
The weekly Bitcoin chart continues to exhibit an ascending channel formation since January. The fact that there have been no breaks in the support and resistance lines of this structure provides an important clue for many investors. Additionally, a close touch to the resistance line in the first week of November followed by selling pressure indicates a period that Bitcoin investors should pay attention to.
The most important support levels to watch on the weekly Bitcoin chart are, respectively; $40,324 / $36,352 and $34,031. Particularly, a weekly bar closing below the $40,324 level, which has been critical for the last two weeks, will lead to serious selling pressure for Bitcoin.
The most important resistance levels to watch on the weekly Bitcoin chart are, respectively; $44,589 / $48,996 and $53,334. Especially, a weekly bar closing above the $44,589 level, which has been a significant resistance recently, will help Bitcoin’s price gain momentum and possibly reach its highest levels in recent times.