Bitcoin (BTC) price has been hovering just above the $25,700 horizontal support area for about a month. While the price action has been bearish, the Relative Strength Index (RSI) reflected a bullish signal that had previously preceded a 100% price increase.
How Much is Bitcoin Worth?
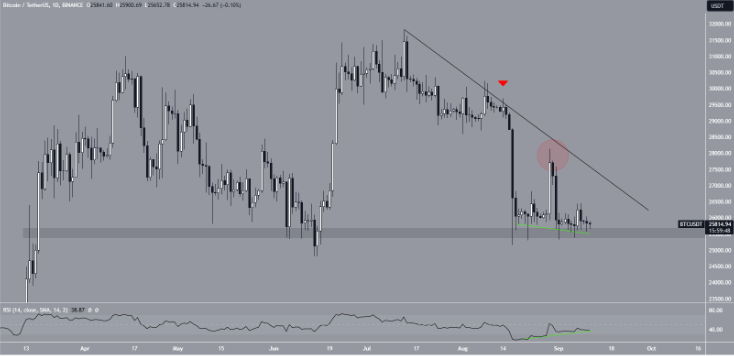
The daily timeframe technical analysis provides mixed signals due to conflicting readings from the price action and the RSI. The BTC price fell below a declining resistance line since reaching the yearly high of $31,800 on July 13. The trendline was last confirmed on August 14 and resulted in a sharp drop towards $25,166 three days later. The price has not yet fallen below this level.
However, the subsequent rebounds have been weak. This is evident in Bitcoin’s failure to reach the descending resistance line (red circle). Now, the BTC price is hovering above the $25,700 horizontal support area.
Despite the bearish values, the Relative Strength Index (RSI) is showing an upward trend. Market participants use the RSI as a momentum indicator to identify overbought or oversold conditions in a market and make decisions on accumulating or selling assets.
Readings above 50 with an upward trend indicate an advantage for the bulls, while readings below 50 indicate the opposite and may signal potential bearish conditions. Although the indicator was below 50, it had been rising since August 18. More importantly, the RSI had formed a significant bullish divergence (green line). This is known as a situation where an increase in momentum accompanies a price decline. It can indicate that the decline is not valid and is often associated with a reversal of the uptrend.
Despite the mixed technical analysis, crypto investors still believe in Bitcoin. A recent report stated that almost half of the world’s crypto millionaires own wealth in Bitcoin. Additionally, the upcoming approval of a Bitcoin ETF can positively impact the future price.

BTC Price Prediction
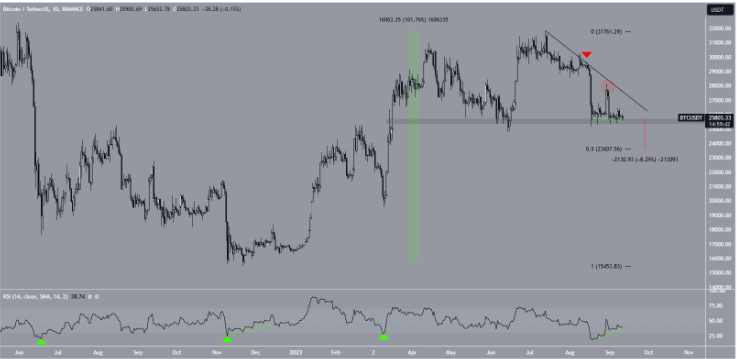
The mentioned bullish divergence on the daily timeframe is noteworthy as it also indicates a movement outside the oversold zone of the RSI. Last year, the RSI fell into the oversold zone and then only moved outside of this zone three times (green dots). Additionally, this bullish divergence occurred only once in the oversold zone in November 2022.
This divergence catalyzed a 100% upward movement that led to the highest level of the year. If another 100% increase occurs, the BTC price will reach $52,000. Nonetheless, a breakout from the resistance line is required for the trend to be considered bullish.
Despite this bullish BTC price prediction, a breakdown from the $25,700 area could indicate further downside. In this case, the most likely outcome would be an 8% drop to the 0.5 Fib retracement support level at $23,600.


