Bitcoin price at the time of writing is finding buyers at $68,000 due to Fed announcements and MTGOX transfers. Bulls struggling to solidify $70,000 as support can’t escape the impact of news flow. So, what do the more reliable on-chain signals indicate for mid-term forecasts?
Will Bitcoin Rise?
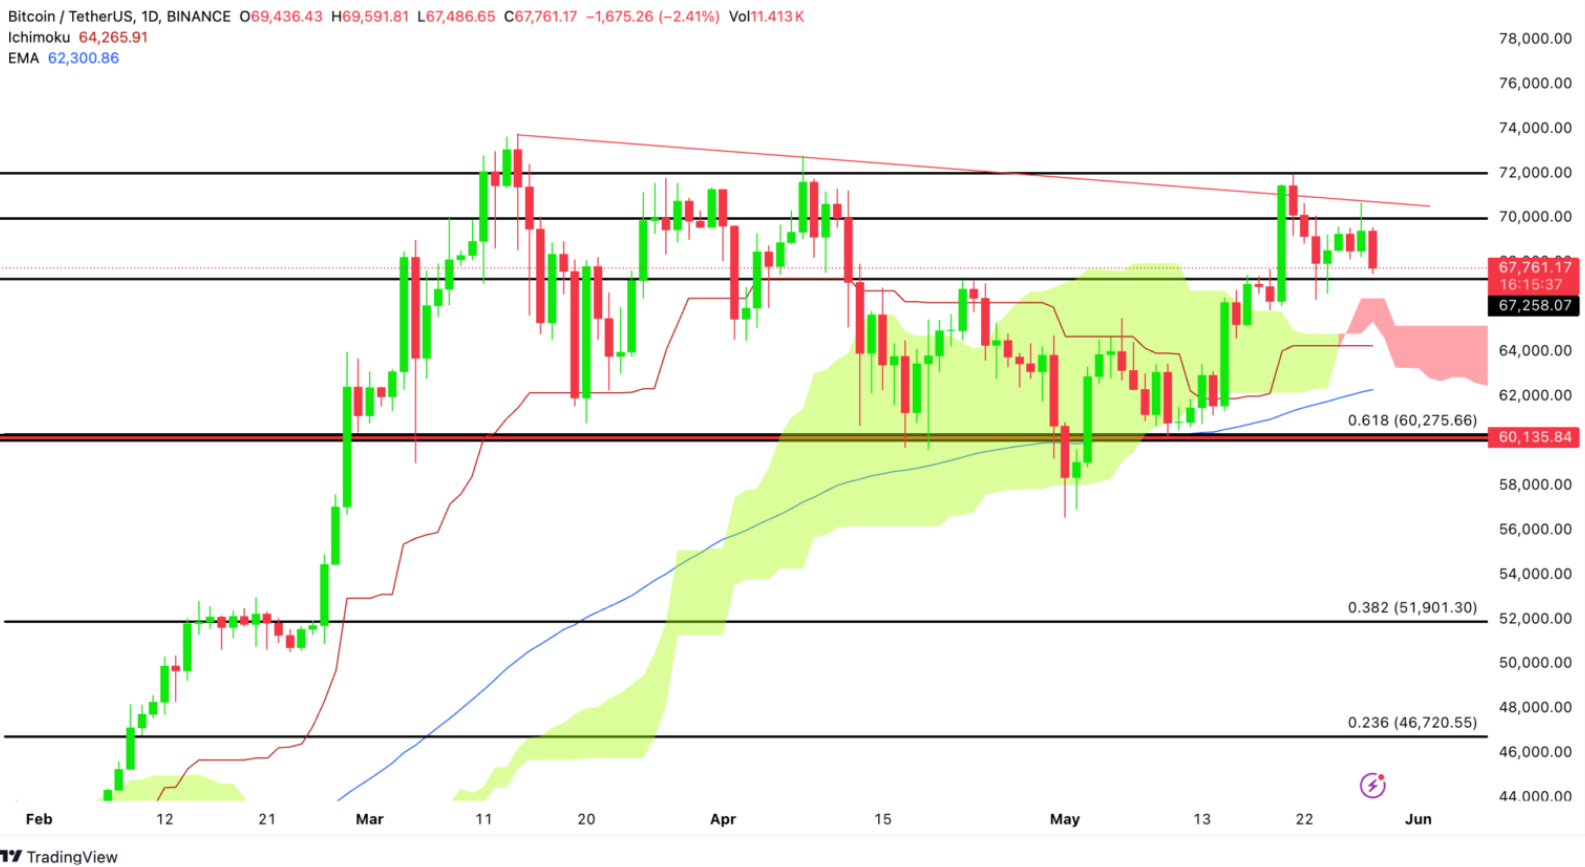
After months of rising, Bitcoin price paused its rally following the last ATH level. Now, with the approval of the Spot ETH ETF, it has risen to the range of $67,500 to $70,000. Staying stuck here for a long time is definitely more promising than testing new dips at $60,000. Moreover, by solidifying the higher support level for a longer period, it could find strength for a new ATH attempt.

The red trend line shows that short-term traders are still eager for profit-taking. BTC price may test the Ichimoku Cloud. If the price falls below the cloud, sentiment will shift to neutral, and we will likely see a new attempt towards $64,000.
Bitcoin On-Chain Commentary
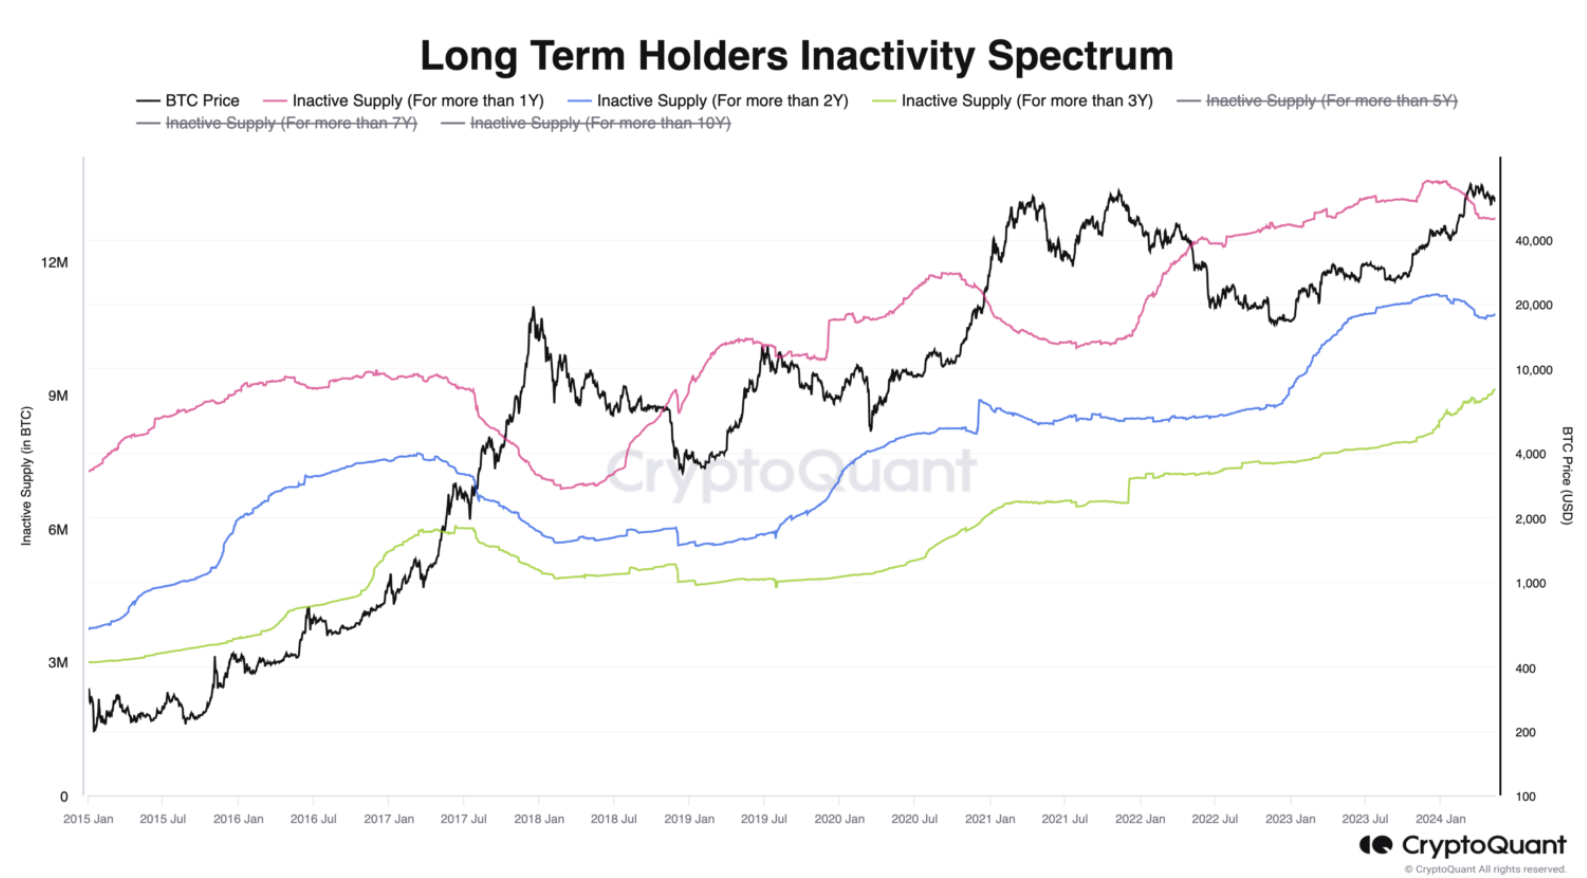
Bitcoin price rises steadily among investors. Long-term holders start profit-taking, and new short-term investors begin accumulating. From the beginning of 2024 to April, there were significant declines in supply active for 1 and 2+ years. However, the supply held in UTXOs (unspent transaction outputs) for over 3 years continued to increase.

Accordingly, the trend for Bitcoin remains upward. The potential for a rise is strong, and a new ATH will come sooner or later. More than half of the total Bitcoin supply has remained in place for over a year. The turnaround at $56,000 showed a shift from selling to holding BTC, as both 1-year+ and 2-year+ cohorts stopped selling and retained their BTC.
1.1% of Bitcoin supply was purchased above $70,000. This small percentage confirms that very few people bought BTC at prices higher than today’s. This supports the narrative that we might not see large sell walls above the current region, reducing the risk of rapid selling during a downturn.
So, what is the conclusion?
- The amount of BTC purchased in the $65,000 to $70,000 range is 6% of the total supply, motivating confidence in this support.
- The thin supply above $70,000 suggests that a strong attempt at $73,000 and above might not be as challenging, potentially moving towards $80,000.
- In any case, a short-term test of $64,000 is possible.
- Long-term investors have stopped selling.

 Türkçe
 Español


