Bitcoin (BTC) lost its gains above $27,000 last week and briefly settled above $26,000 before starting the new week with losses in the range of $26,000 to $25,000. Currently trading at $25,677 with a market cap of $500 billion, the largest cryptocurrency has lost 0.79% in the past 24 hours. Both on-chain data and micro indicators indicate that there could be a sharp drop in BTC’s price before a significant recovery during the expected bull market after the 2024 halving of block rewards.
Bitcoin’s Price in Search of Support
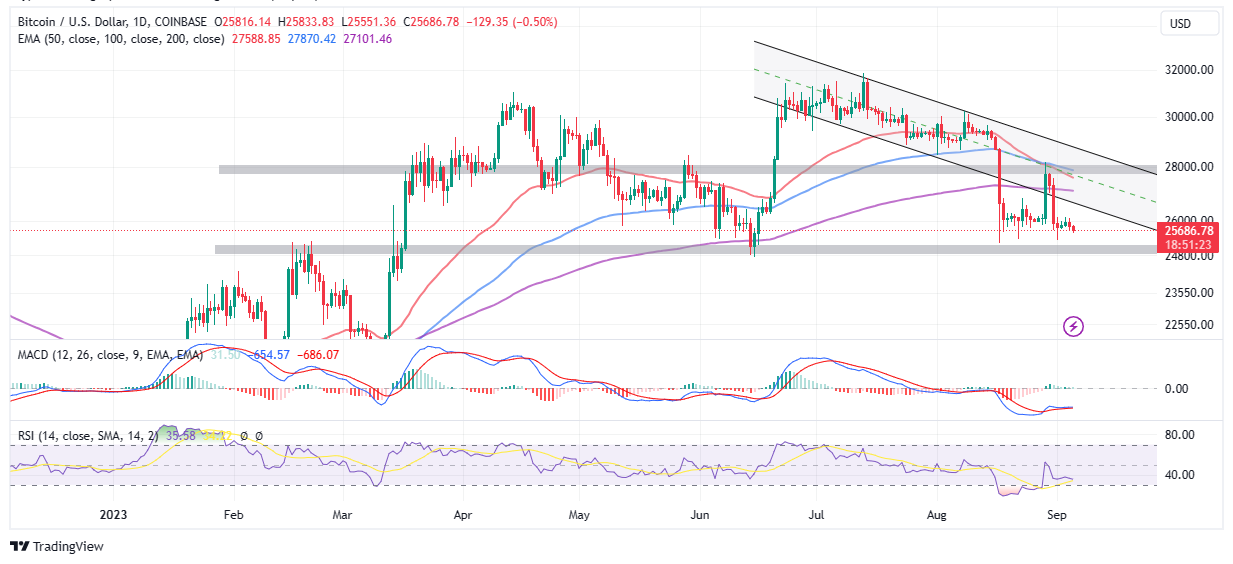
Bitcoin’s price has reached a significant turning point towards the support level of $25,000, which is likely to lead to consolidation before a major breakout. If bulls reclaim the support/resistance at $26,000, a recovery can be expected. Last week, the inability to hold above the support level of $27,000, which is the lower bound of the descending channel, led to the loss of gains up to $26,000. Therefore, a breakout from the descending channel’s resistance level or a move beyond the $28,000 resistance is required for a recovery.

Furthermore, the Relative Strength Index (RSI), which entered the oversold condition last week, has returned to the neutral zone, indicating that neither buyers nor sellers have a clear advantage in the sideways price movement. This also suggests that BTC’s price could have a volatile market condition and move between the support of $25,000 and the resistance of $26,000 for a while before the next breakout. This movement could result in a downward move towards $20,000 or an upward move towards $30,000.
The Moving Average Convergence Divergence (MACD) indicator also confirms this sideways price movement. As the gap between the blue MACD line and the red signal line increases and the momentum indicator generally climbs towards the average line (0.00) and the positive zone, investors and traders may expect an increase in BTC’s price.
Scary Formation on the Price Chart: Head and Shoulders
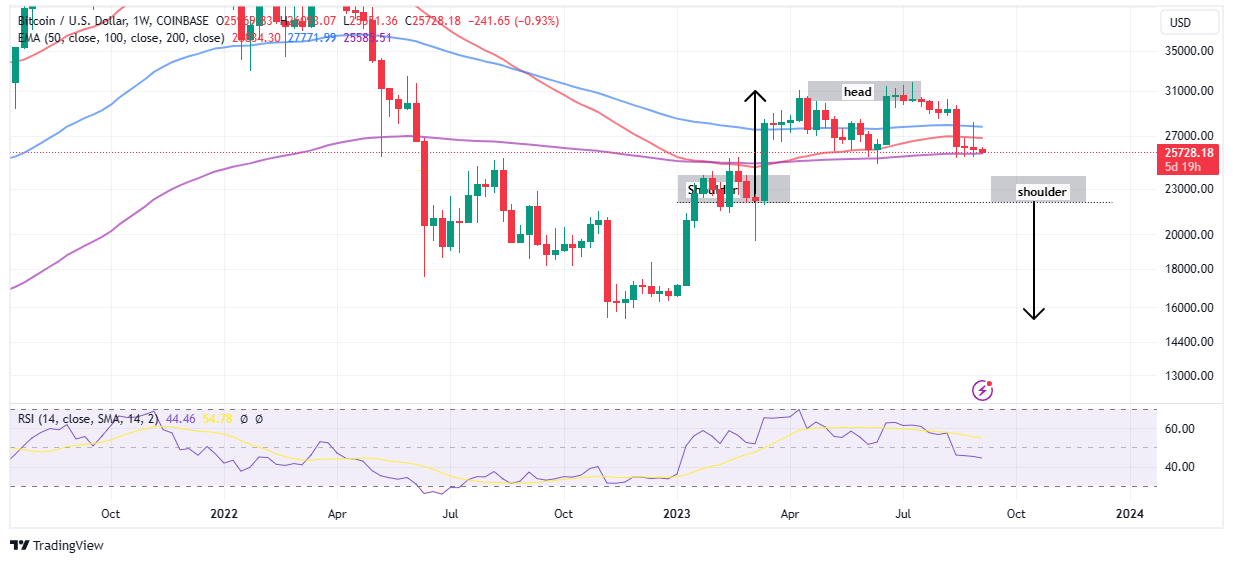
Bitcoin is in the process of forming a Head and Shoulders (H&S) formation on the weekly timeframe price chart, which is a major bearish signal, indicating that the price could drop much lower before the start of a bull run. However, for the formation to be completed, the price of BTC needs to break below the support of $25,000, which is reinforced by the 200-day Exponential Moving Average (EMA) (purple).

The RSI confirms the downward trend on Bitcoin as it targets the oversold territory below the 30 level. For the confirmation of the formation, the price needs to break below the neckline at $22,072. In the face of such a breakout, bears could push the price of the largest cryptocurrency below $20,000. With a sudden increase in volume accompanying this price movement, the ultimate target could be around $15,500, the last bottom level.
Crypto investor and analyst Rekt Capital predicts a similar scenario, stating that BTC has not yet hit bottom and could drop below $20,000 to sweep the liquidity at the main support level around $15,500 before the next bull market. For now, investors need to closely monitor the $25,000 support. As long as this support holds, there can be an expectation of a recovery above $30,000, which would invalidate the H&S formation.


