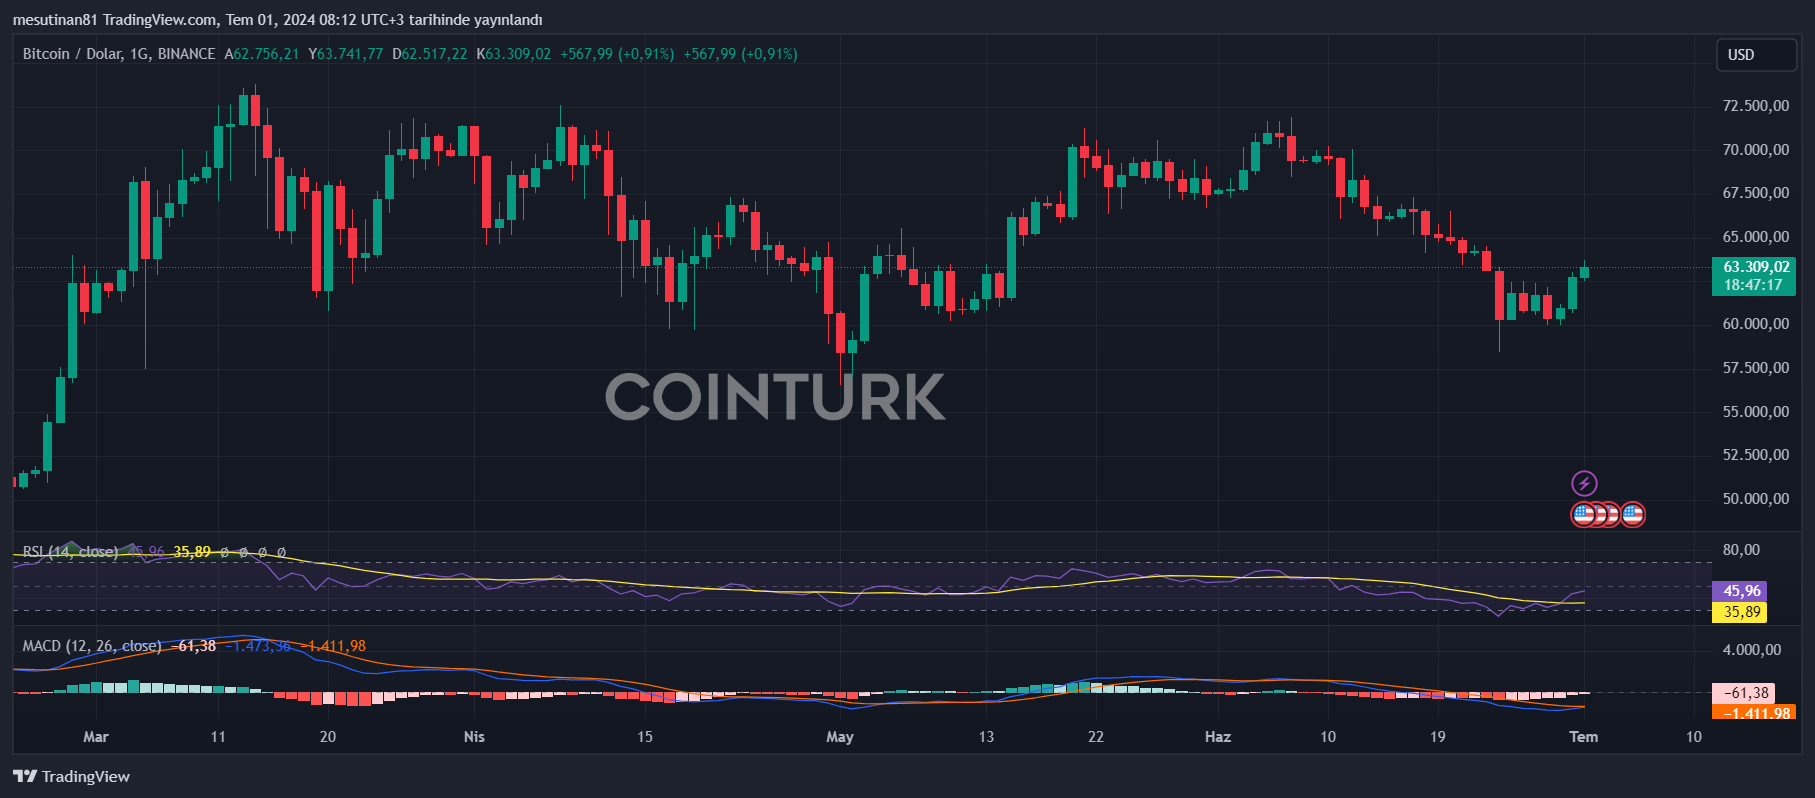
Bitcoin, started July with an increase of approximately 5%. Accordingly, the price rose above the $63,800 level, creating a positive trend in the markets. Initially forming a solid base above the $60,000 level, BTC achieved a steady increase thanks to this support. The price movement, gaining momentum by surpassing the $61,500 resistance zone, violated a major downtrend line on the hourly chart of the BTC/USD pair.
Important Levels for Bitcoin
Bitcoin is currently trading above $63,200 and is well above the 100-hour Simple Moving Average (SMA) level of $62,450. The next important resistance level for BTC is set at $63,900.
If Bitcoin manages to surpass this resistance, it may encounter resistance at several important levels. The first significant resistance is at $64,000, followed by $64,400. A decisive move above $64,400 could potentially push the price to the $65,500 level. Further gains could even lead BTC to test the $66,000 resistance in the near term.
Possible Downward Movements in BTC
The leading cryptocurrency Bitcoin may undergo a downward correction if it fails to surpass the $63,900 resistance zone. The first support on the downside is near the $62,800 level, followed by the support level around $61,800. This level is also aligned with the 50% Fibonacci retracement level of the recent upward move. Additional support is formed around $61,250, coinciding with the 100-hour SMA. Failure to hold these support levels could push the price towards the $60,500 support zone.

Technical indicators currently provide a favorable environment for Bitcoin. The hourly MACD is gaining momentum in the bullish zone, indicating the continuation of upward potential. Additionally, the hourly RSI (Relative Strength Index) for the BTC/USD pair is above the 50 level, reinforcing the strength of the current trend.
Key resistance zones to watch include $63,650, $64,000, and $64,400. Conversely, the support levels of $62,800, $61,800, and $61,250 should be considered critical in the event of a downward correction.


