Bitcoin (BTC) made a strong move towards $71,000 at the beginning of the week, forming a new low. Market sentiment turned optimistic again, and investors are targeting surpassing the all-time high of $74,000. Multiple on-chain indicators suggest that this bullish momentum could continue and BTC might rise to new heights. Let’s examine the three key indicators pointing to this continuous upward trend.
Bitcoin Whales Resume Accumulation Mode
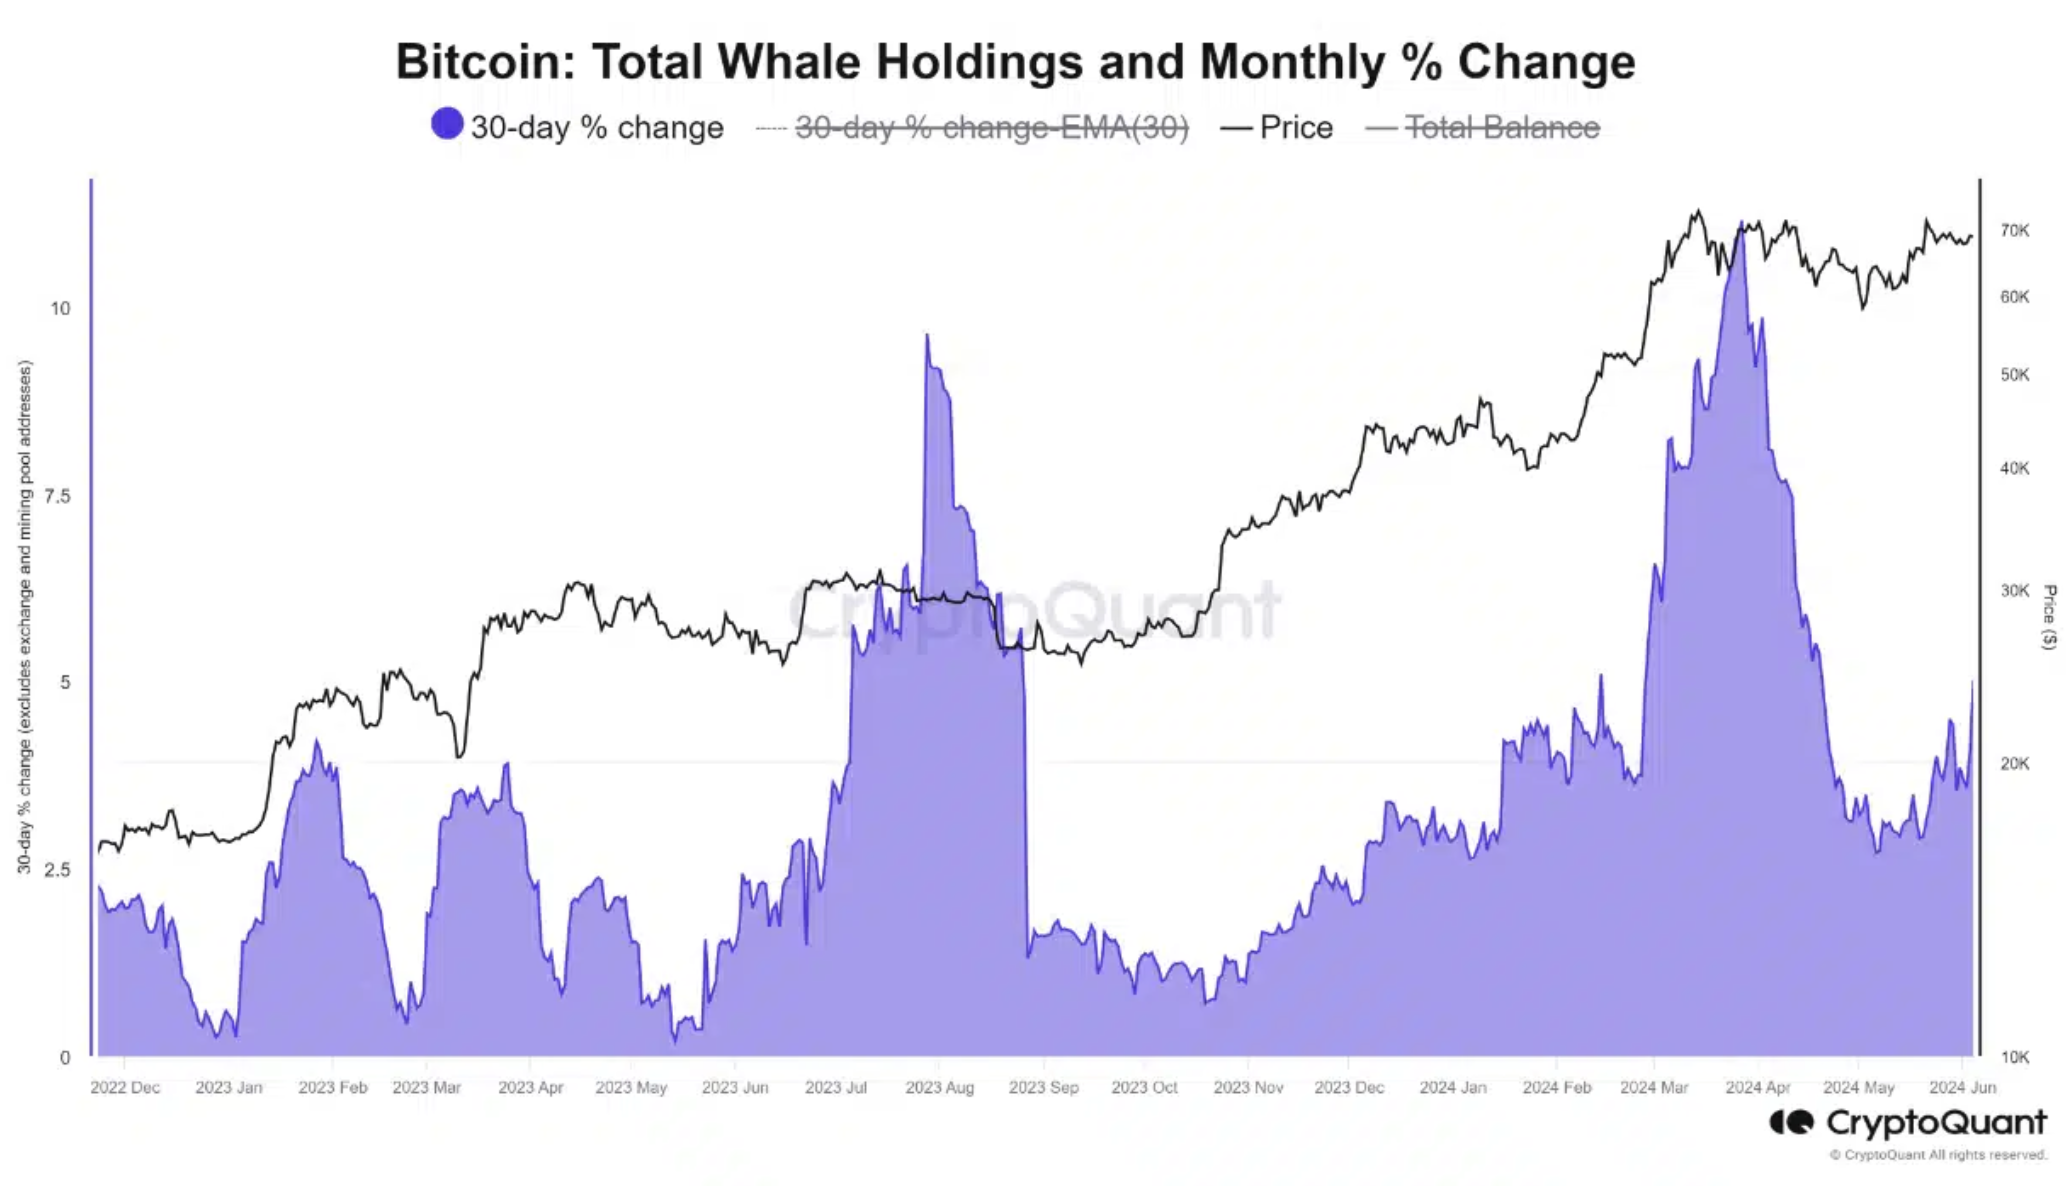
CryptoQuant data reveals that institutional investors have resumed accumulation in the past two weeks after a significant distribution phase in March. This renewed buying activity is already affecting the price and is expected to strengthen further in the coming weeks.

If institutional accumulation continues, Bitcoin could enter a new price discovery zone and potentially reach an all-time high.
NVT Golden Cross Indicator Signals a Bottom
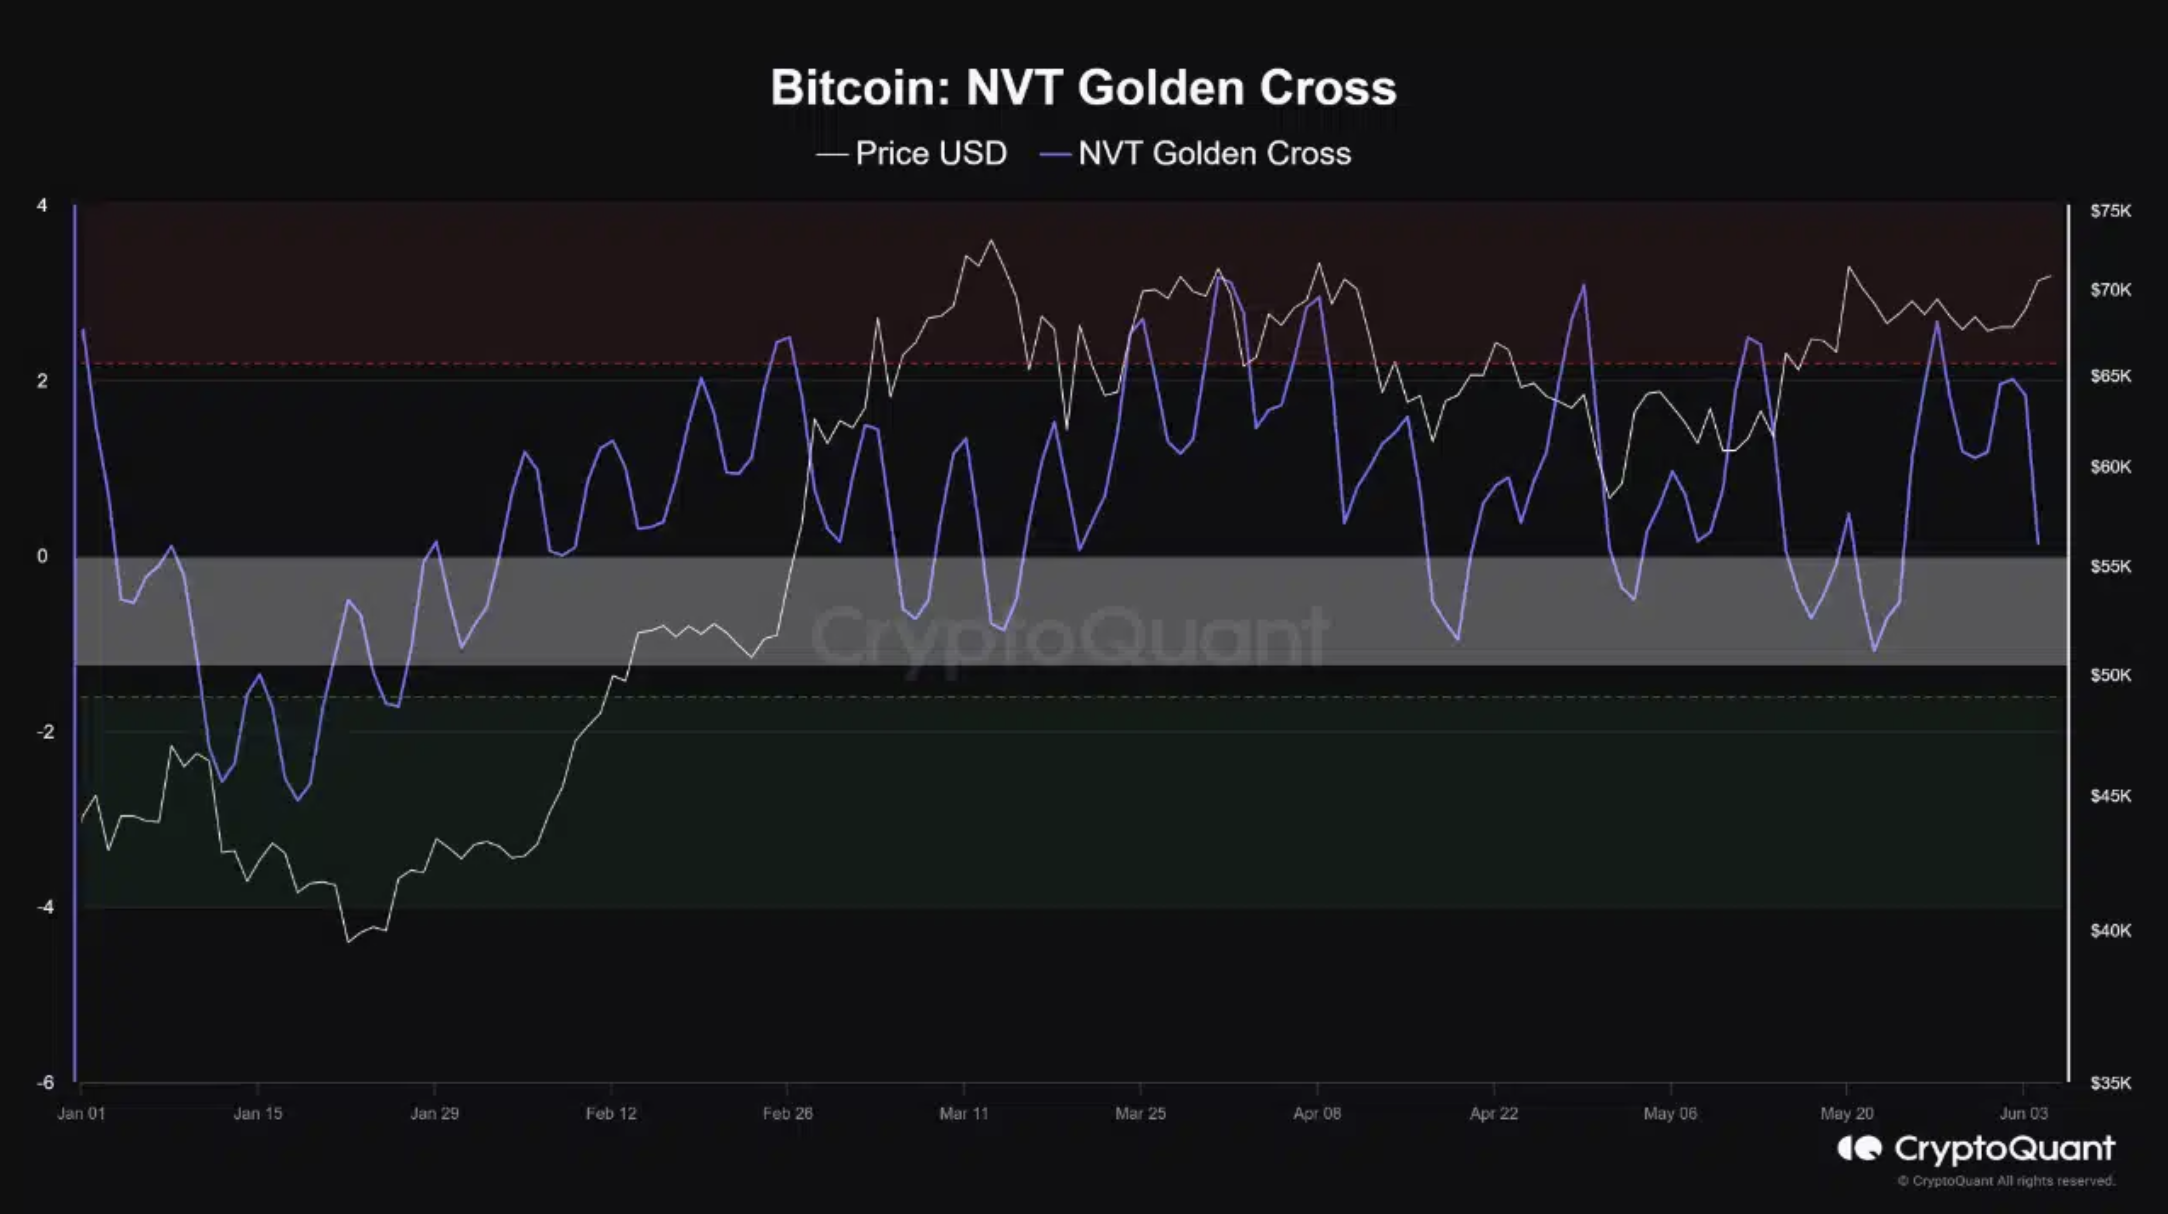
The NVT Golden Cross (NVT GC) indicator tracked by CryptoQuant has consistently formed local bottoms in the 0.00 to -1.00 point range since February 2024. Currently, NVT GC stands at 0.14 points, indicating a potential local bottom in the $69,000 – $70,000 range. Additionally, a recent $886.6 million inflow into spot Bitcoin ETFs in the US supports this analysis.

CryptoQuant noted that the NVT GC indicator should be closely monitored as it approaches the critical white zone, which could signal further bullish momentum.
Bitcoin Volatility Index and Adjusted MVRV
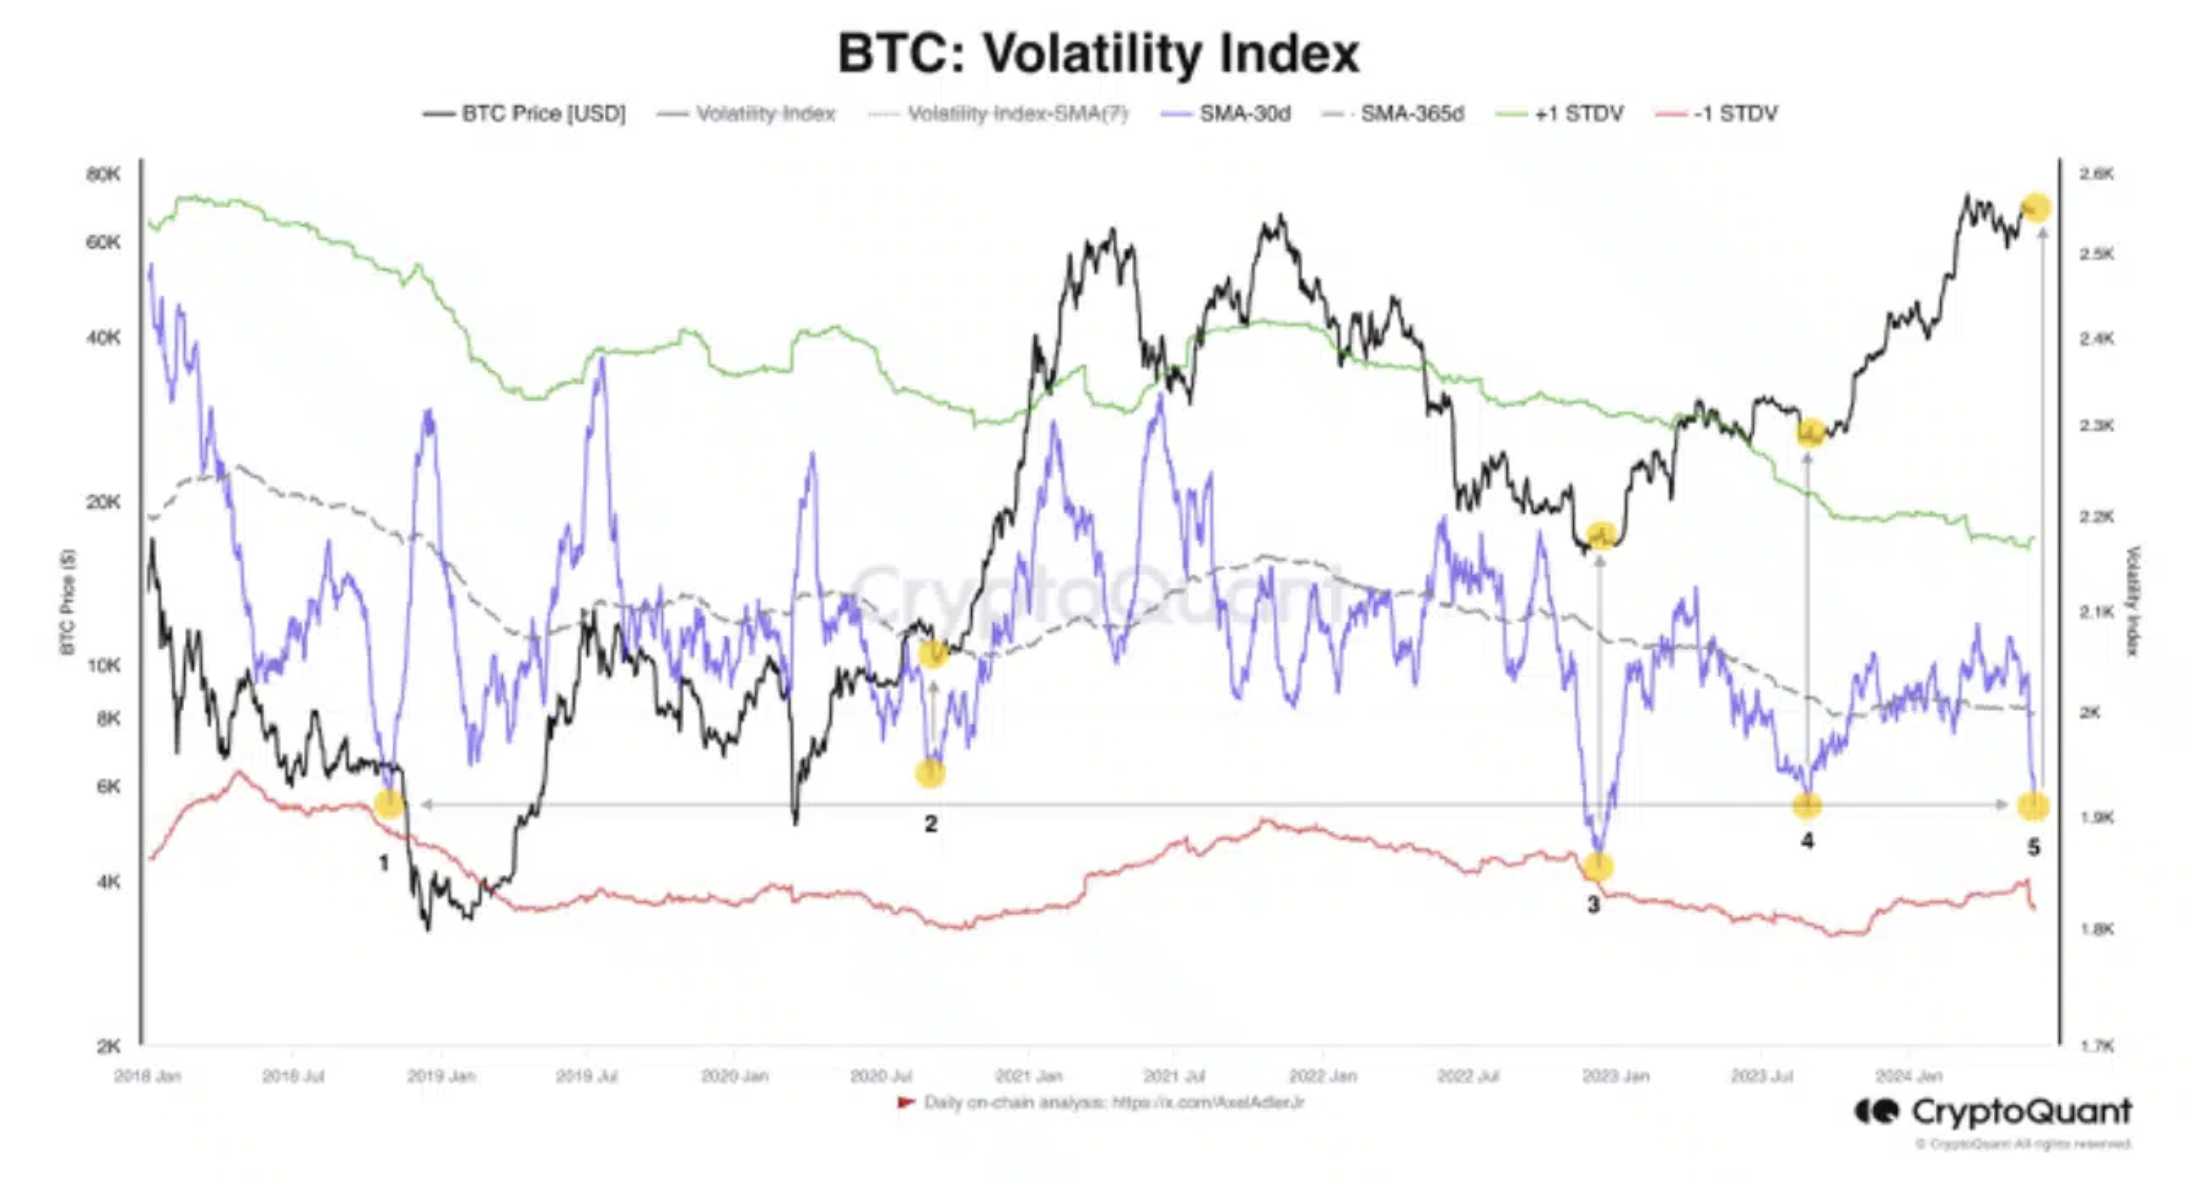
The Bitcoin Volatility Index (SMA-30d), a significant indicator of Bitcoin’s price volatility, is currently experiencing a notable decline. This index, which accounts for trading activities on cryptocurrency exchanges, indicates a potential slowdown in price volatility for the largest cryptocurrency.
Historical data shows only four instances of such low volatility in the past six years. While this unusual calmness suggests stability, some analysts approach it cautiously, suggesting it might precede significant market movements.

Moreover, the Adjusted MVRV (30DMA/365DMA) metric provides insights into the current bull market‘s structure. This analysis highlights similarities between the current market trajectory and the 2015-2018 period, indicating a smooth progression without the turbulence of the previous cycle. Bitcoin, currently past the halfway point of the bull market, appears to be on a steady upward path.
In addition to these indicators, Bitcoin’s open interest (OI) surpassed $2 billion in the past three days, indicating high interest in the derivatives market. This increase in OI is typically associated with significant price movements, suggesting that Bitcoin could potentially reach new heights.


 Türkçe
 Español


