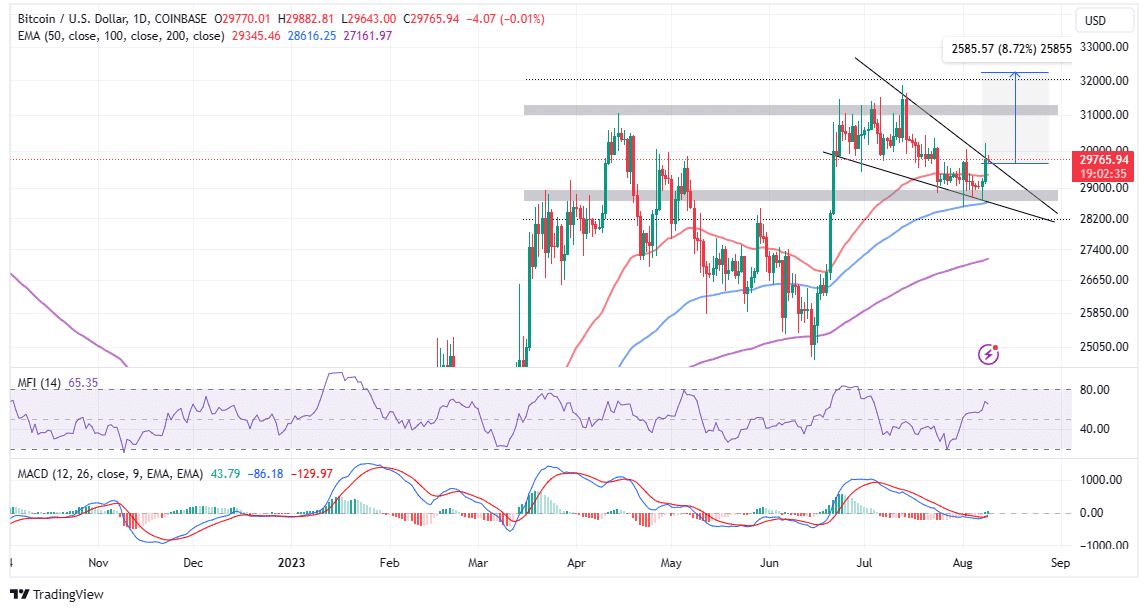
The price of the largest cryptocurrency, Bitcoin (BTC), has caught attention by tightly holding in a narrow range between $29,000 and $30,000 for several weeks. This consolidation phase has caused a deep silence in the cryptocurrency market, while the technical outlook indicates that this silence will be broken very soon.
Bitcoin’s Critical Threshold: $30,000
Bitcoin’s price, which reached above $30,000 on August 8 and dropped to $29,730 towards the end of today’s Asian trading session, is changing hands with a 1.8% increase in the last 24 hours and a market value of $577 billion. The low volatility is considered the biggest obstacle to BTC making a directional price movement. Vivien Fang, the head of trading products at Bybit, one of the leading cryptocurrency exchanges, stated that the record-low volatility prevents the price of the largest cryptocurrency from making a directional movement. Fang expects the current situation to continue until the end of the year due to investors focusing on potential spot ETF narratives or catalysts related to transformative events in the sector.

Technically, Bitcoin’s price hovering near the $30,000 level indicates a significant region that could lead to a major breakout towards $40,000. The descending wedge formation on the daily price chart suggests that a breakout may occur soon, although it may be short-term. This bullish formation indicates a potential reversal or continuation of the upward trend. This formation is formed when the price makes lower highs and lower lows in a narrowing range, creating a wedge-like shape.
The wedge formation indicates a breakout when the price rises above the upper trend line, showing that buyers have taken control and are ready to push the price higher. Bitcoin investors using the descending wedge formation can determine entry and exit points to place buy or sell orders. For example, a long position can be opened with a candle close near the $30,000 level, above the upper trend line, and a candle close below the recent low level just above $29,000 can be used as a stop-loss level.
Investors can also set a target level for the upward move by considering the height of the wedge formation as a profit-taking point. This suggests that an 8.78% rise to approximately $32,247 can be seen from the breakout point.
Confirmation of Potential Upside in Price
Despite the ordinary trading environment in the cryptocurrency market, Bitcoin’s price can surpass $30,000 this week according to the bullish outlook on the daily chart. Investors looking for buying signals can carefully monitor the Moving Average Convergence Divergence (MACD) indicator.
When the blue line of the MACD crosses above the red signal line, investors may take action for buying and the expected breakout of the descending wedge formation may occur rapidly. Breakouts above $30,000 should be closely monitored to determine whether they are sustainable or if they result in bull traps.


Convenient to me
It’s good to me
It’s achievable