The negativity in Bitcoin‘s price and the decrease in volumes have caused altcoin investors to suffer greater losses. Ten days after the January 12th drop, BTC experienced another rapid sell-off on January 22nd. This decline, which caused double-digit percentage losses in altcoins, brought with it a test of the $38,500 level. However, more could be possible. On the other hand, Bitcoin Ordinal Inscription tokens ORDI, SATS are experiencing faster losses.
Why Are ORDI and SATS Dropping?
There was certainly a significant drop in altcoins, but the ETF news selling event affected ordinal tokens like ORDI and SATS even more. We had mentioned in our articles at the end of 2021 that the Taproot update opened the door to such tokens, and a long time has passed since then, with the ordinal craze starting around the middle of last year.
They made big gains and were listed on popular exchanges. However, after the approval of the ETF, the price of ORDI and SATS dropped by 34% and 50% (respectively) in January. The main reason for the decline was the billion-dollar sales in the market. Although individual investors remained hopeful, large investors made billion-dollar sales in a single day.
But that’s not the only problem. The correlation coefficient of these two tokens, which were expected to share a high correlation with Bitcoin and derive their strength from BTC, also dropped to 0.66. Until recently, this was positive. The breakdown of the correlation could mean that the excitement here may have also faded.
Predictions for ORDI and SATS
The ETF approval was expected to further increase interest in the Bitcoin ecosystem, and it probably will in the long run. The intense demand for BTC layer2 solutions and the competition in this area confirm this. However, the outlook for ORDI and SATS in the short term does not look very bright.
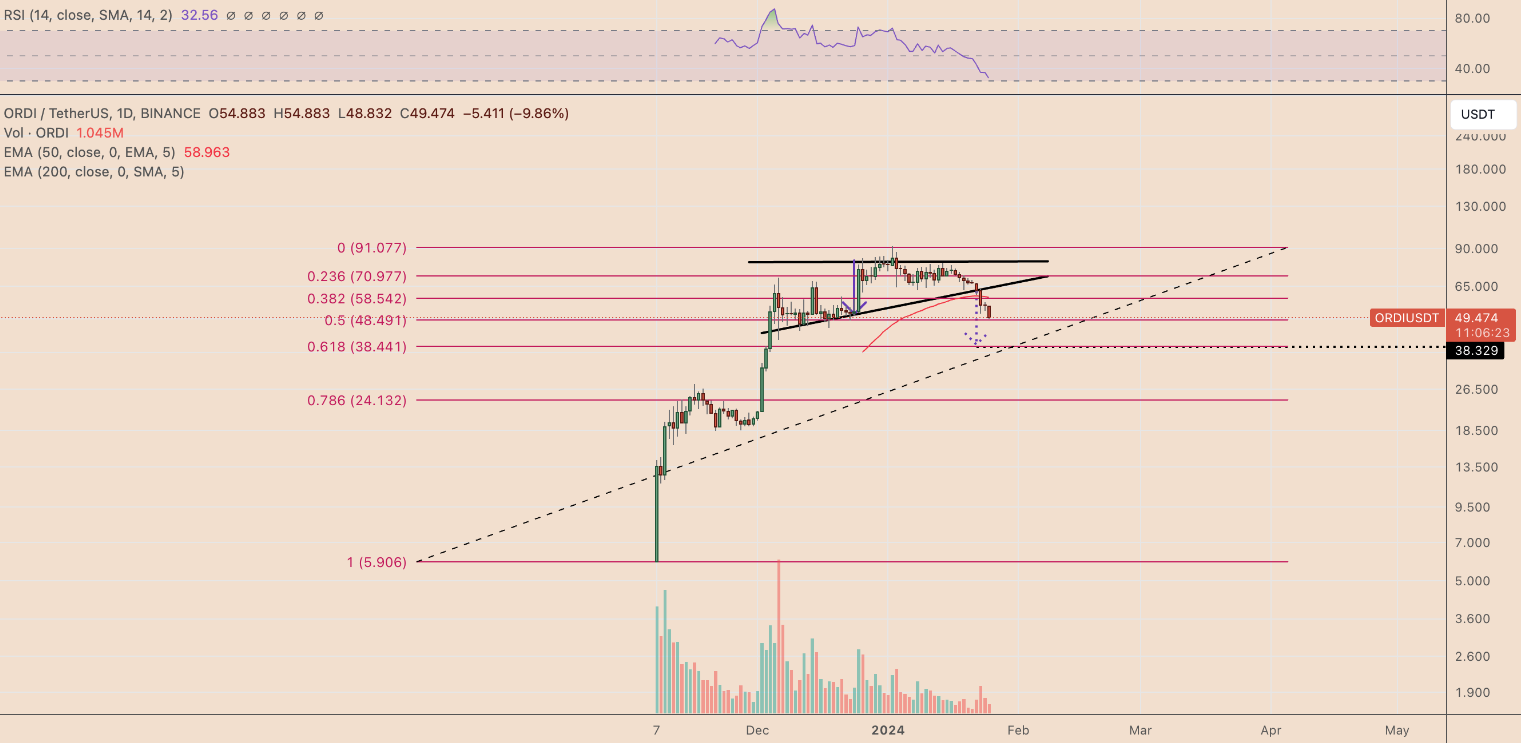
Signs of the decline had also come from the technical front. For example, a classic bearish divergence pattern formed on the ORDI/USDT daily chart between December 5 and January 2. While the price was making weaker highs, the RSI was falling, indicating decreasing demand. This suggests that deeper lows could be approaching.
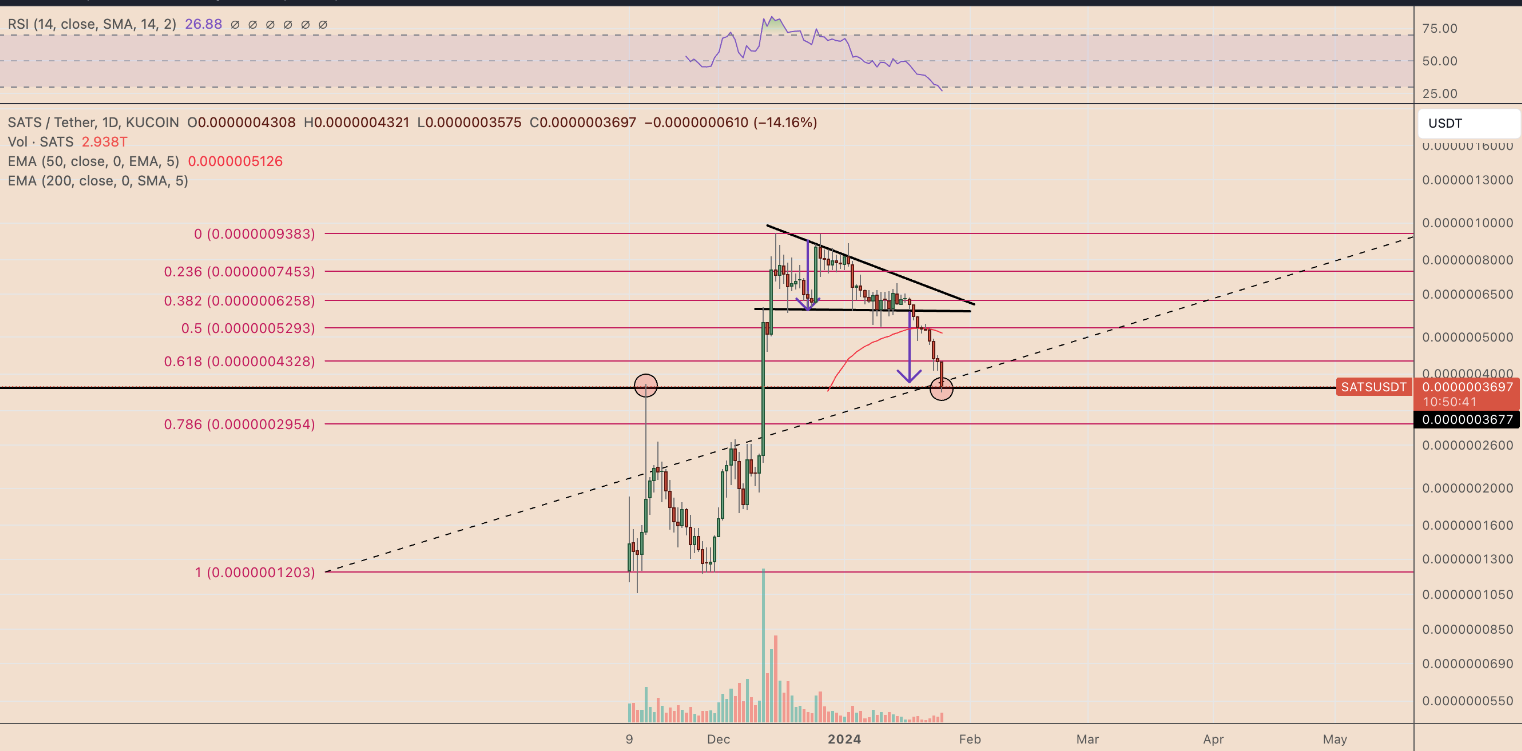
Similarly, this bearish divergence pattern formed on the SATS chart, and the price has since experienced a decline of nearly 60%. A continued drop for the ORDI Token still seems possible. With the breaking of the rising triangle, we could see a drop to $38.5.

The outlook for the SATS Token is relatively more positive because the previous resistance is turning into support, and the oversold period has been completed. The RSI has retreated to 30.

As the oversold SATS Token has managed to turn resistance into support, it could reach the peak price of $0.00000043 within the next week. However, if the $0.00000036 support is lost, a new low of $0.0000029 could be made.


 Türkçe
 Español


