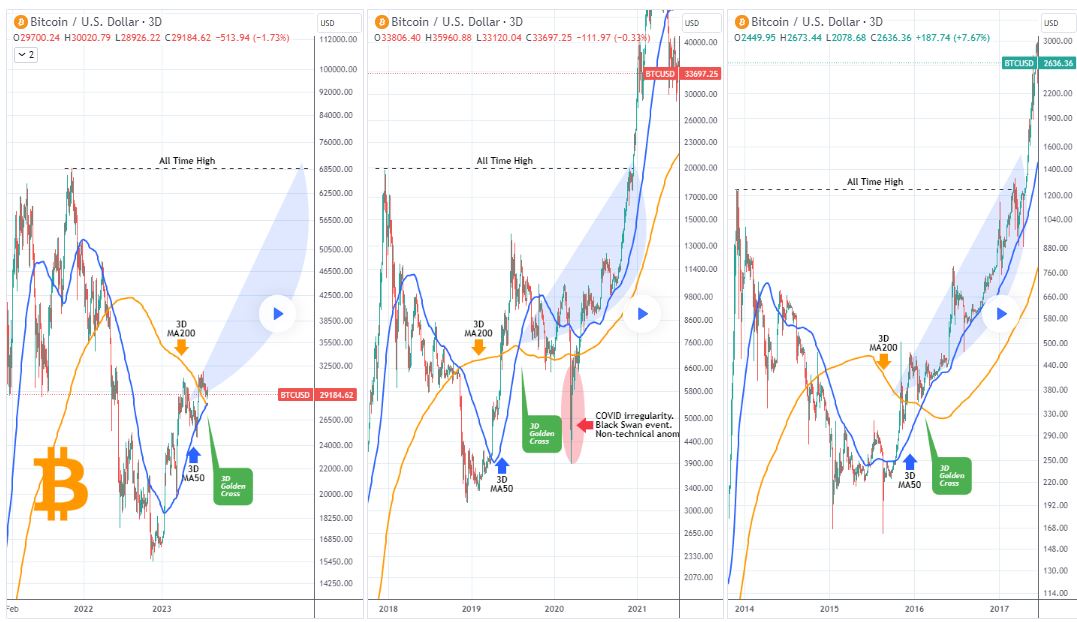
Bitcoin (BTC) continues to stay below the $30,000 level, unable to surpass a key resistance level in the midst of its long-term consolidation in the market. Technical analysis on Bitcoin’s price chart, based on past price movements, indicates that the largest cryptocurrency could soon reach its all-time high.
Bitcoin’s “Golden Cross” Announcement
Anonymous crypto analyst TradingShot reported in an article published on TradingView on August 4th that the formation of the golden cross, a significant bullish signal in the long term for the world’s first and largest cryptocurrency, has been completed.

According to TradingShot’s analysis, in the previous two instances where the formation occurred, Bitcoin experienced significant price rallies. In both instances, after the formation of the golden cross, the 200-day moving average turned into a strong support level, aiding the continuation of the upward trend. However, it should be noted that the exceptional conditions of the Black Swan event, the March 2020 crash, caused a temporary interruption in the typical formation.
Drawing parallels with previous cycles, the analyst highlighted that the 50-day moving average, which guides the price movement in a three-day time frame, could be the next possible target for Bitcoin’s upward movement, with the previous all-time high around $69,000. Additionally, the analyst attributed the faster attainment of the golden cross in 2019 compared to the Facebook-cancelled cryptocurrency project Libra frenzy and other positive factors contributing to the increased adoption of Bitcoin. Conversely, reaching the all-time high in 2020 took a bit longer, occurring in approximately 100 days more than the previous cycle.
TradingShot concluded the analysis by stating that it would be fair to predict that Bitcoin will reach its previous all-time high (69,000 dollars) and set a new record around this time next year.
What’s Next for Bitcoin after the Golden Cross?
The golden cross formation occurs when a short-term moving average crosses above a long-term moving average. When the most recent golden cross formation appeared on Bitcoin’s chart, the price was trading above the 50-day moving average and the 200-day moving average in a three-day time frame, indicating a positive trend change for the largest cryptocurrency.
In general, BTC has shown significant volatility in recent times, and the impact of the golden cross on price is seen as a sign of optimism in the trajectory of the leading cryptocurrency. Particularly, it leads to a consensus on the possibility of Bitcoin reaching new highs.
Bitcoin HODLers, whose number is of great importance among on-chain data, indicate that 69.2% of investors have no intention of selling their BTC. Additionally, the amount of BTC sent to crypto exchanges has decreased in recent weeks, indicating a significant decrease in selling pressure.
Although a short-term drop in price below $29,000 is expected, the next block reward halving, expected to take place in 2024, is anticipated to trigger a new cycle of upward movement and drive the price to new record levels.


 Türkçe
 Español


