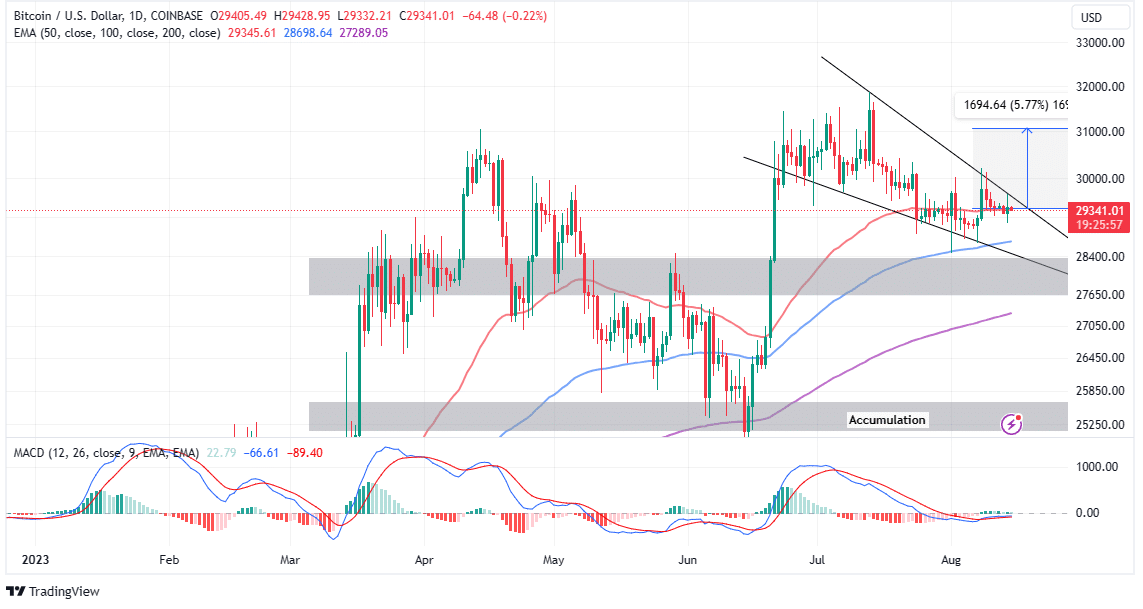
Despite Bitcoin‘s (BTC) price dropping below $30,000, it continues to hold above $29,000. While many investors are staying away from the market due to the stagnation, the price of the largest cryptocurrency seems to be preparing for a major rally.
Bitcoin’s Price Faces Key Bullish Formation
In the past 24 hours, BTC’s price has remained relatively unchanged, trading at $29,360. If the price continues to hold above the short-term support at $29,200, there is a possibility of a sudden rally, supported by the descending wedge formation on the four-hour time frame.

The descending wedge formation is a bullish pattern that occurs when the price of an asset falls within a narrow range, forming a wedge-like shape on the chart. This formation indicates a weakening selling pressure and suggests that buyers are ready to take control. To trade based on the descending wedge formation, investors need to wait for a breakout above the upper trendline of the wedge, which is currently around $29,400. Such a breakout would confirm the upward momentum and initiate the expected rally.
The breakout from the descending wedge formation is often accompanied by an increase in volume, which adds validity to the bullish signal. The target price can be estimated by measuring the height of the descending wedge formation and adding it to the breakout point. For example, a breakout above $29,400 could lead to a 5.77% increase in price, reaching $31,074.
For BTC to rise towards the end of the year and surpass the strong resistance level at $30,000, it needs a catalyst. Market experts speculate that the largest cryptocurrency could experience a pre-rally before the upcoming block reward halving event in April 2024, potentially pushing the price above $40,000. Based on this expectation, the breakout from the descending wedge formation could be a significant trigger for the rally, especially for individual investors.
In addition, the Moving Average Convergence Divergence (MACD) indicator is closely watched for a potential buying signal that would further support the bullish outlook. Investors who rely on this momentum indicator typically wait for the blue MACD line to cross above the red signal line before making a buying decision. In the current outlook, it can be expected that the MACD will turn upward and show an upward trend as it returns to the positive zone above the average line.
Stay Alert for a Liquidity Accumulation Operation
While Bitcoin investors are waiting for the price to surpass the $30,000 threshold, there is a possibility of a pullback to accumulate liquidity without dropping below $29,000 or even $28,000 in the short term. According to the four-hour price chart, Bitcoin is currently trading below all significant moving averages, including the 200-day EMA at $29,432, the 100-day EMA at $29,386, and the 50-day EMA at $29,372, indicating a bearish trend. This situation, combined with the dominance of bears and the nearly confirmed sell signal from the MACD, could result in BTC closing the day around $29,000.
So far, Bitcoin has attempted to accumulate liquidity around the $29,000 level several times, but these liquidity pools have not been sufficient to push the price above $30,000. Glassnode, a on-chain data platform, noted in its general market analysis on August 14th that “Bitcoin’s price is extremely volatile, but the market is currently facing an extreme volatility compression. Option markets clearly reflect this situation, and it appears that Bitcoin is no longer showing excessive volatility or that the volatility may be mispriced.”


