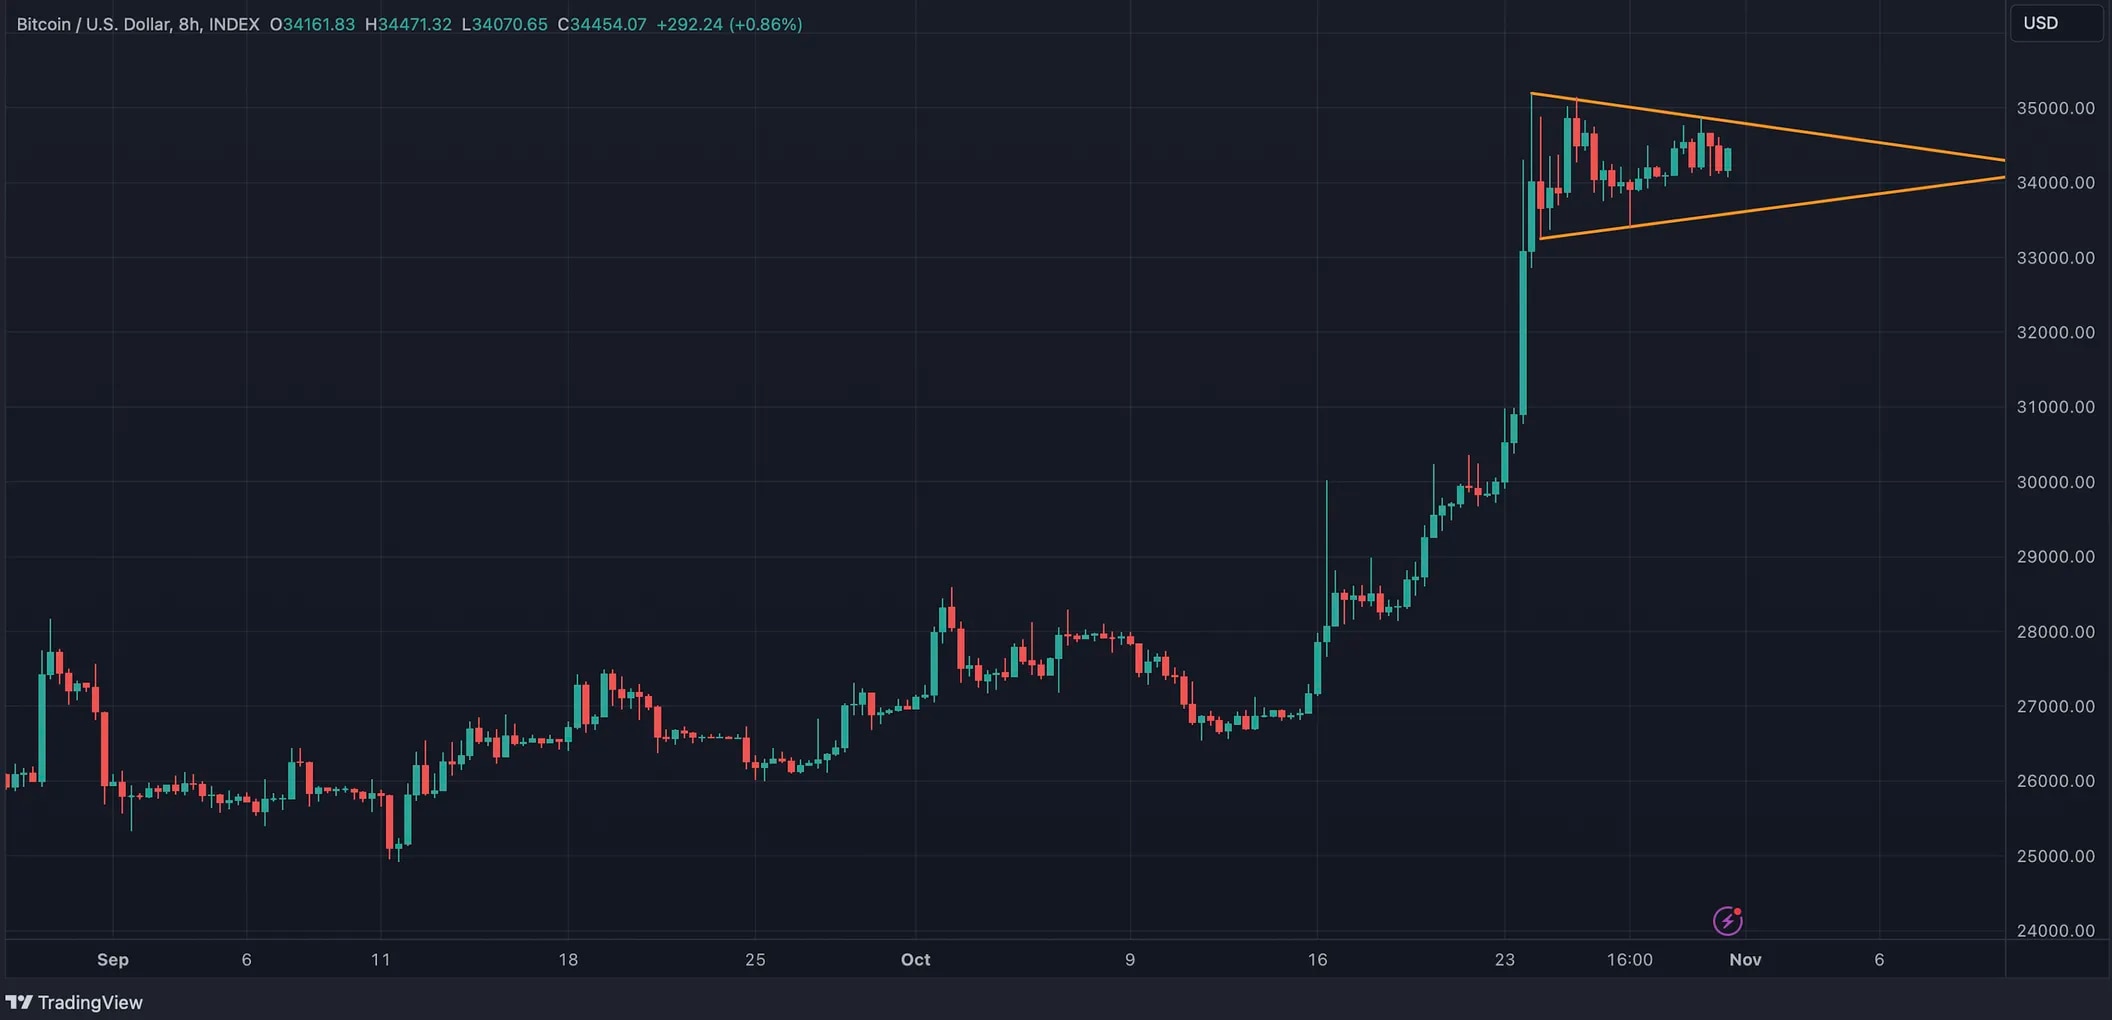
The largest cryptocurrency, Bitcoin (BTC), has formed a triangle formation on its price chart characterized by rising bottoms and falling tops in the past seven days, with a price range between $33,000 and $35,000. So, what does this triangle formation mean for BTC? Let’s take a closer look.
Triangle Formation on Bitcoin’s Price Chart
Analysts and investors tend to examine technical formations formed on price charts to measure the strength of momentum and predict changes in market trends. In technical analysis, triangle formations tend to represent a continuation of the previous uptrend that pauses for the price to consolidate before further upward movement.

Before forming the triangle formation, the largest cryptocurrency rose from $26,500 to $35,000 and is currently consolidating within this formation, temporarily pausing its upward movement.
The $35,000 Level is Critical for the Triangle Formation
Alex Kuptsikevich, Senior Market Analyst at FxPro, drew attention to the triangle formation on Bitcoin’s price chart. The analyst stated, “A triangle formation has formed on Bitcoin’s daily timeframe price chart. Usually, such consolidation formations are expected to end with an upward breakout.” This suggests that the formation could trigger a continuation of the upward movement.
According to Kuptsikevich, a price rise above $35,000 would confirm the breakout of the triangle formation and signal the continuation of the rally that started at $26,500. The breakout would bring the price to the $40,000 level. As of the latest data, Bitcoin is trading at $34,332, down 0.95% in the last 24 hours.
While triangle formations tend to show a tendency towards a breakout in the direction of the previous trend, they can sometimes end with a downward breakout, indicating the end of the uptrend. Therefore, investors need to closely monitor Bitcoin’s price movements in the next few days. The triangle formation is expected to be resolved by November 10-11 at the latest, and a directional breakout in the price can be anticipated.


