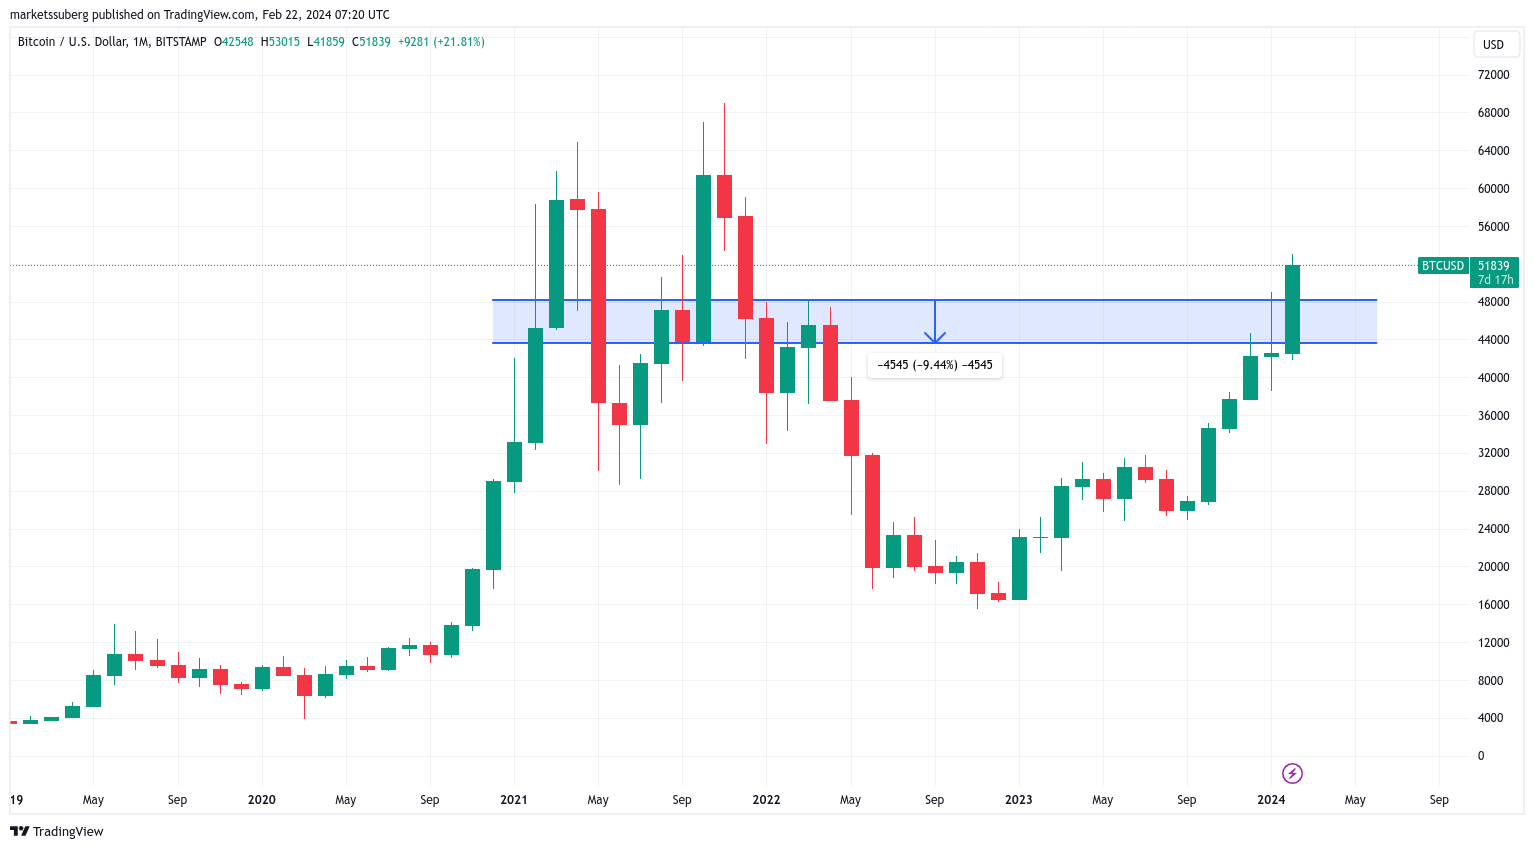
Bitcoin is expected to experience a pullback during the block subsidy halving in April, but the exact timing remains uncertain. Popular investor and analyst Rekt Capital, in his latest YouTube video on February 20, forecasted a Bitcoin price movement that mirrors the 2016 and 2020 bull runs.
Why Is Bitcoin Declining?
Bitcoin has been trading in a narrow corridor for over a week, with the $52,000 level acting as a resistance zone. This situation has negatively impacted both altcoin price performance and market sentiment, yet experienced market observers maintain their optimism. Rekt Capital analyzed previous all-time high studies and identified fundamental stages common to both bull market setups:
“Historically, breaking a macro downtrend always precedes the upward movement of the halving. This is followed by a pullback before the halving event, then a re-accumulation period after the halving, and finally a parabolic price movement towards all-time highs.”
An accompanying graph shows the BTC/USD pair breaking its initial downward trend line but getting caught at a resistance zone it had previously formed. The breakout and subsequent retest as support, a pre-halving pullback stage, is notably missing so far in 2024. Data from TradingView confirms that the area of interest for a pre-halving pullback is around $45,000.

Previously, Rekt Capital concluded that the BTC/USD pair had fully entered its pre-halving rise and added that significant price events are arriving faster in this cycle compared to previous ones.
Prominent Analysts Offer Noteworthy Comments
Meanwhile, other analysts commenting on the current price movement see little reason for a downturn amidst the recent fluctuations. Caleb Franzen, founder of research platform Cubic Analytics, stated to his subscribers on February 22:
“Bitcoin is trading at the same price as 7 days ago. It has been trading between $50,600 and $53,000 for the last 7 days, but the lowest daily close was $51,600. I really don’t understand the panic or the victory laps of the bears.”
Analyst Matthew Hyland agreed overall, highlighting the significance of the 0.618 Fibonacci retracement level just above $48,000 from the all-time high, and stated:
“If it drops below $49,000 the picture changes, but consolidation in an uptrend favors the continuation of the rise.”


 Türkçe
 Español


