The king of cryptocurrencies continues to keep its monthly candle green. The price is hovering around $28,000 while altcoins remain calm. Altcoins had to end their rally early this week due to the volatility in the BTC price. However, Binance Coin (BNB), the largest cryptocurrency exchange by volume, may initiate a new upward movement.
BNB Coin Analysis
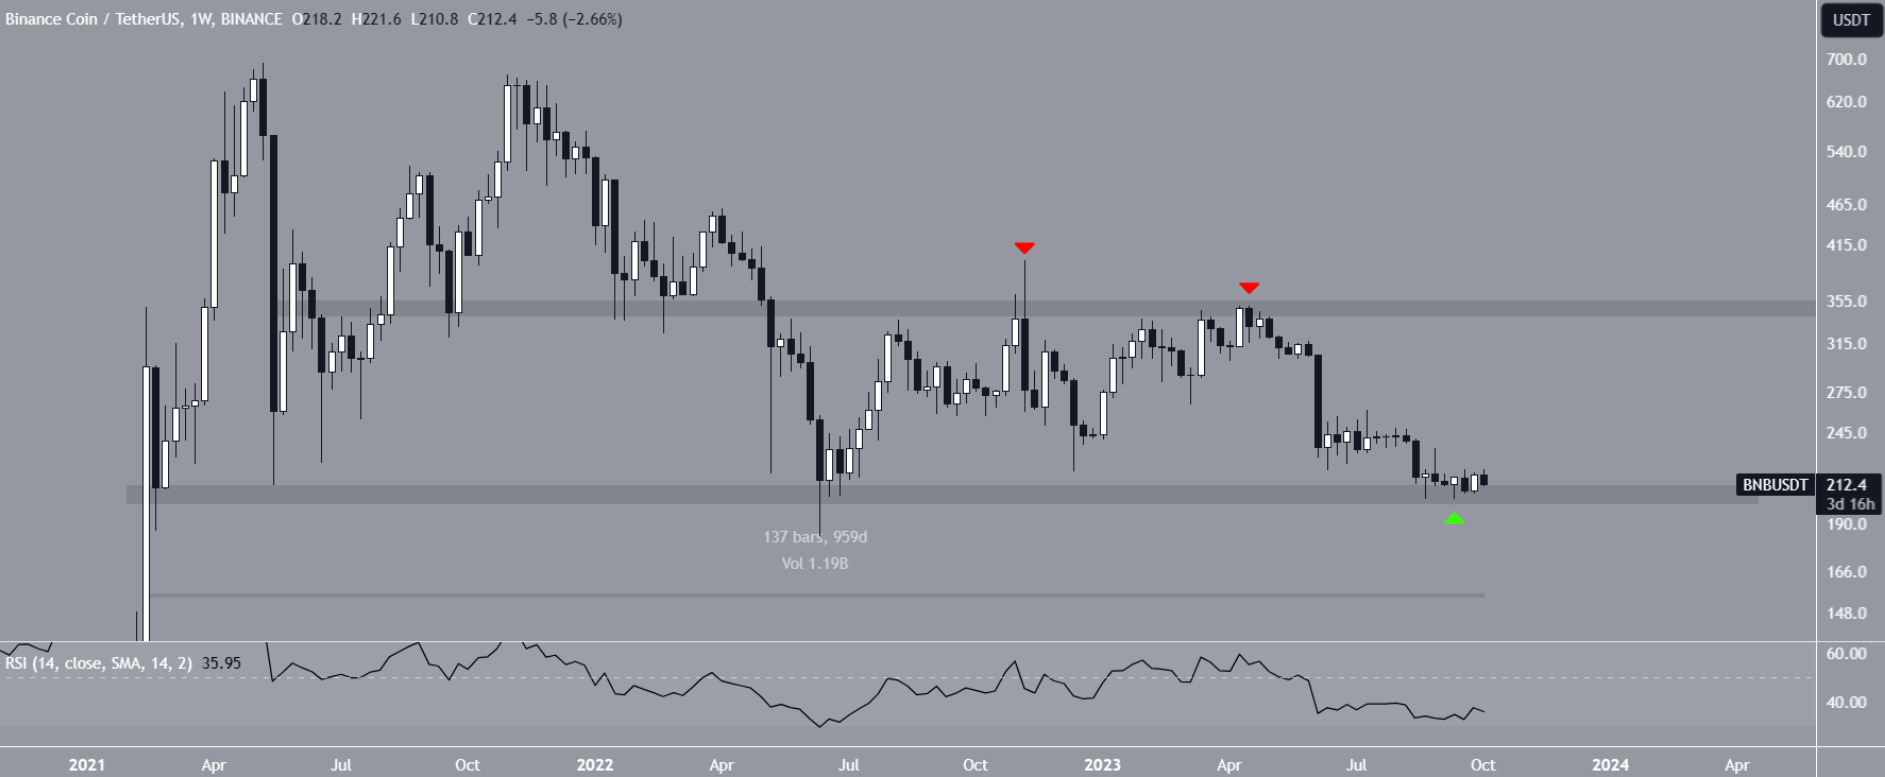
The popular altcoin continues to find buyers at the long-term support level of $210. A bullish double bottom formation has formed, supporting the expectation of an uptrend. However, the BNB Coin price is still below the descending resistance line, which may be partly due to the rapid fluctuations in BTC price.
On the weekly chart, the price is holding onto the 910-day horizontal support area and has made several bounces from this zone. We had seen the price rise from this area during the week of September 11-18. The weekly RSI indicates the current weakness in the probability of an uptrend. Many cryptocurrencies are experiencing a clear lack of demand and weak risk appetite.

The headlines surrounding the exchange also affect the price movements. For example, Binance has been sued by victims who claim that it caused damage to the bankrupt crypto exchange FTX. We don’t need to go into detail about this as we have discussed it at length, but the fact that FTX would go bankrupt even without Binance’s involvement is widely accepted.
BNB Coin Price Prediction
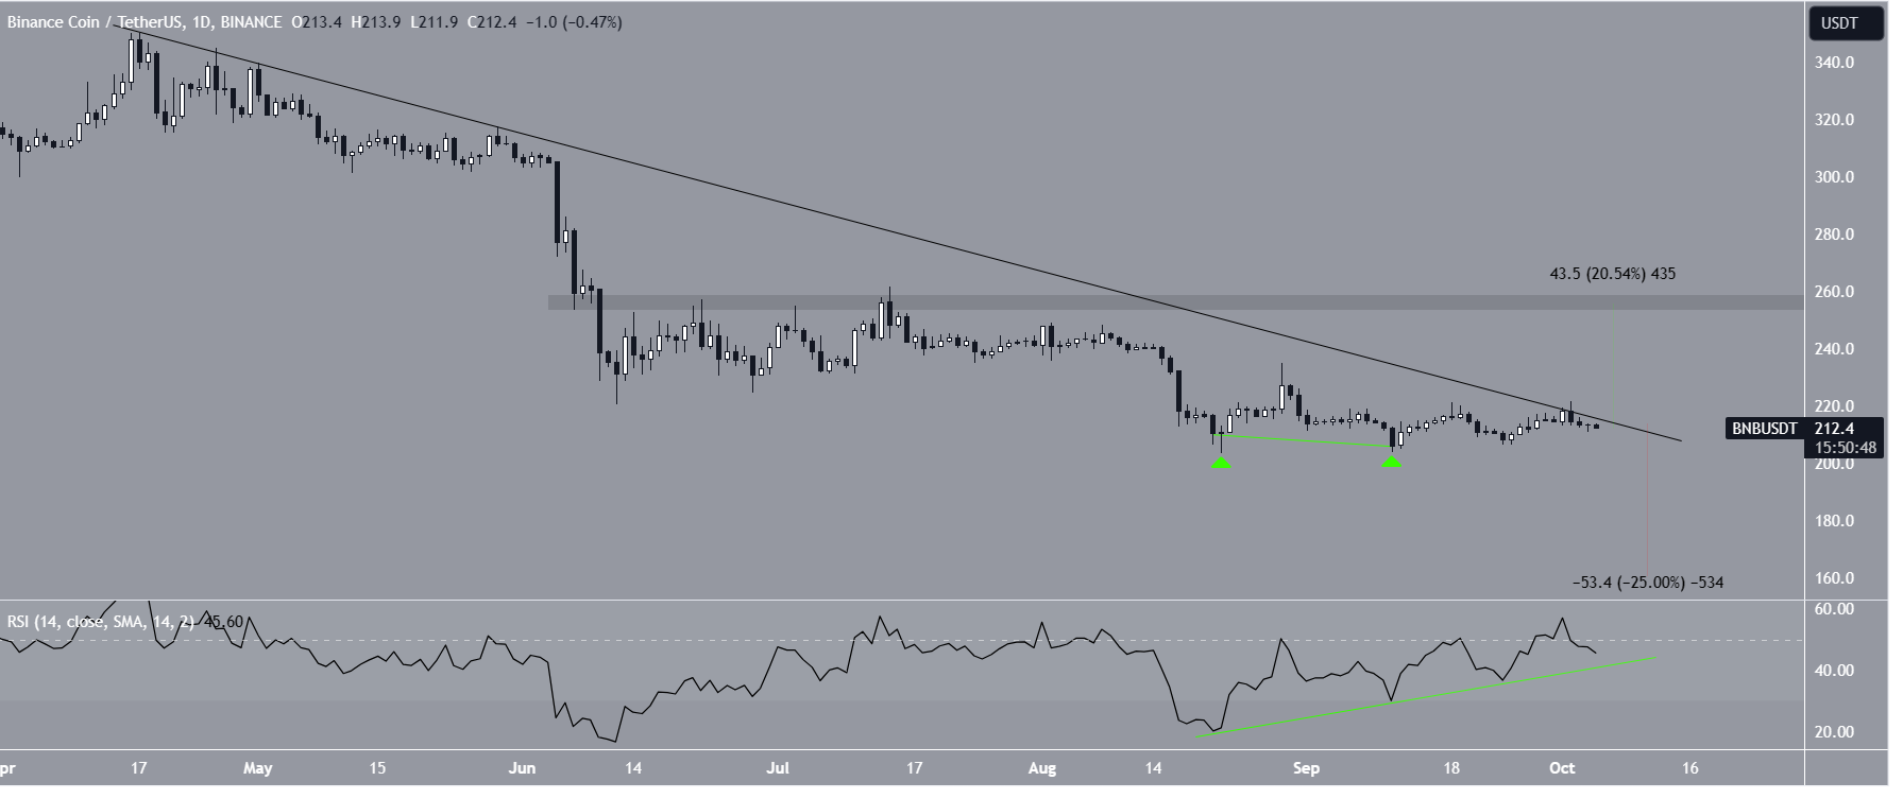
The readings on the daily chart paint a more moderate picture compared to the weekly chart. This is due to the double bottom formation between August 22 and September 11. As mentioned earlier, this formation forms the basis of the bullish expectation.
Furthermore, the daily RSI is combined with a bullish divergence. When a price decline is accompanied by an increase in momentum, a bullish divergence occurs. In addition to these bullish signs, the price will need to break above the descending resistance trendline.

If we see an upward breakout, the price is likely to reach $255 with a 25% increase. However, closing below $210 will invalidate the double bottom formation and indicate further downward movement. In the bearish scenario, the target is the $160 support level.
BTC is currently continuing its indecisive movements. Depending on the direction of futures trading, the price is moving within liquidity zones.


